390+ Tabs of Pure
Analytics Power
Every tool a professional options trader needs, in one platform. GEX analysis, AI-powered signals, volatility modeling, spread detection, pattern recognition, and risk management — all running locally on your machine.
729
Tickers
390+
Analytics Tabs
134
AI Agents
11
Trading Modes
75.7%
Signal Accuracy
150K+
Signals Scored
55+
Signal Types
Core Analytics
Institutional-Grade Options Intelligence
32 flagship analytics modules form the backbone of OPEX Trader. Each processes live market data through proprietary algorithms to surface actionable insights.
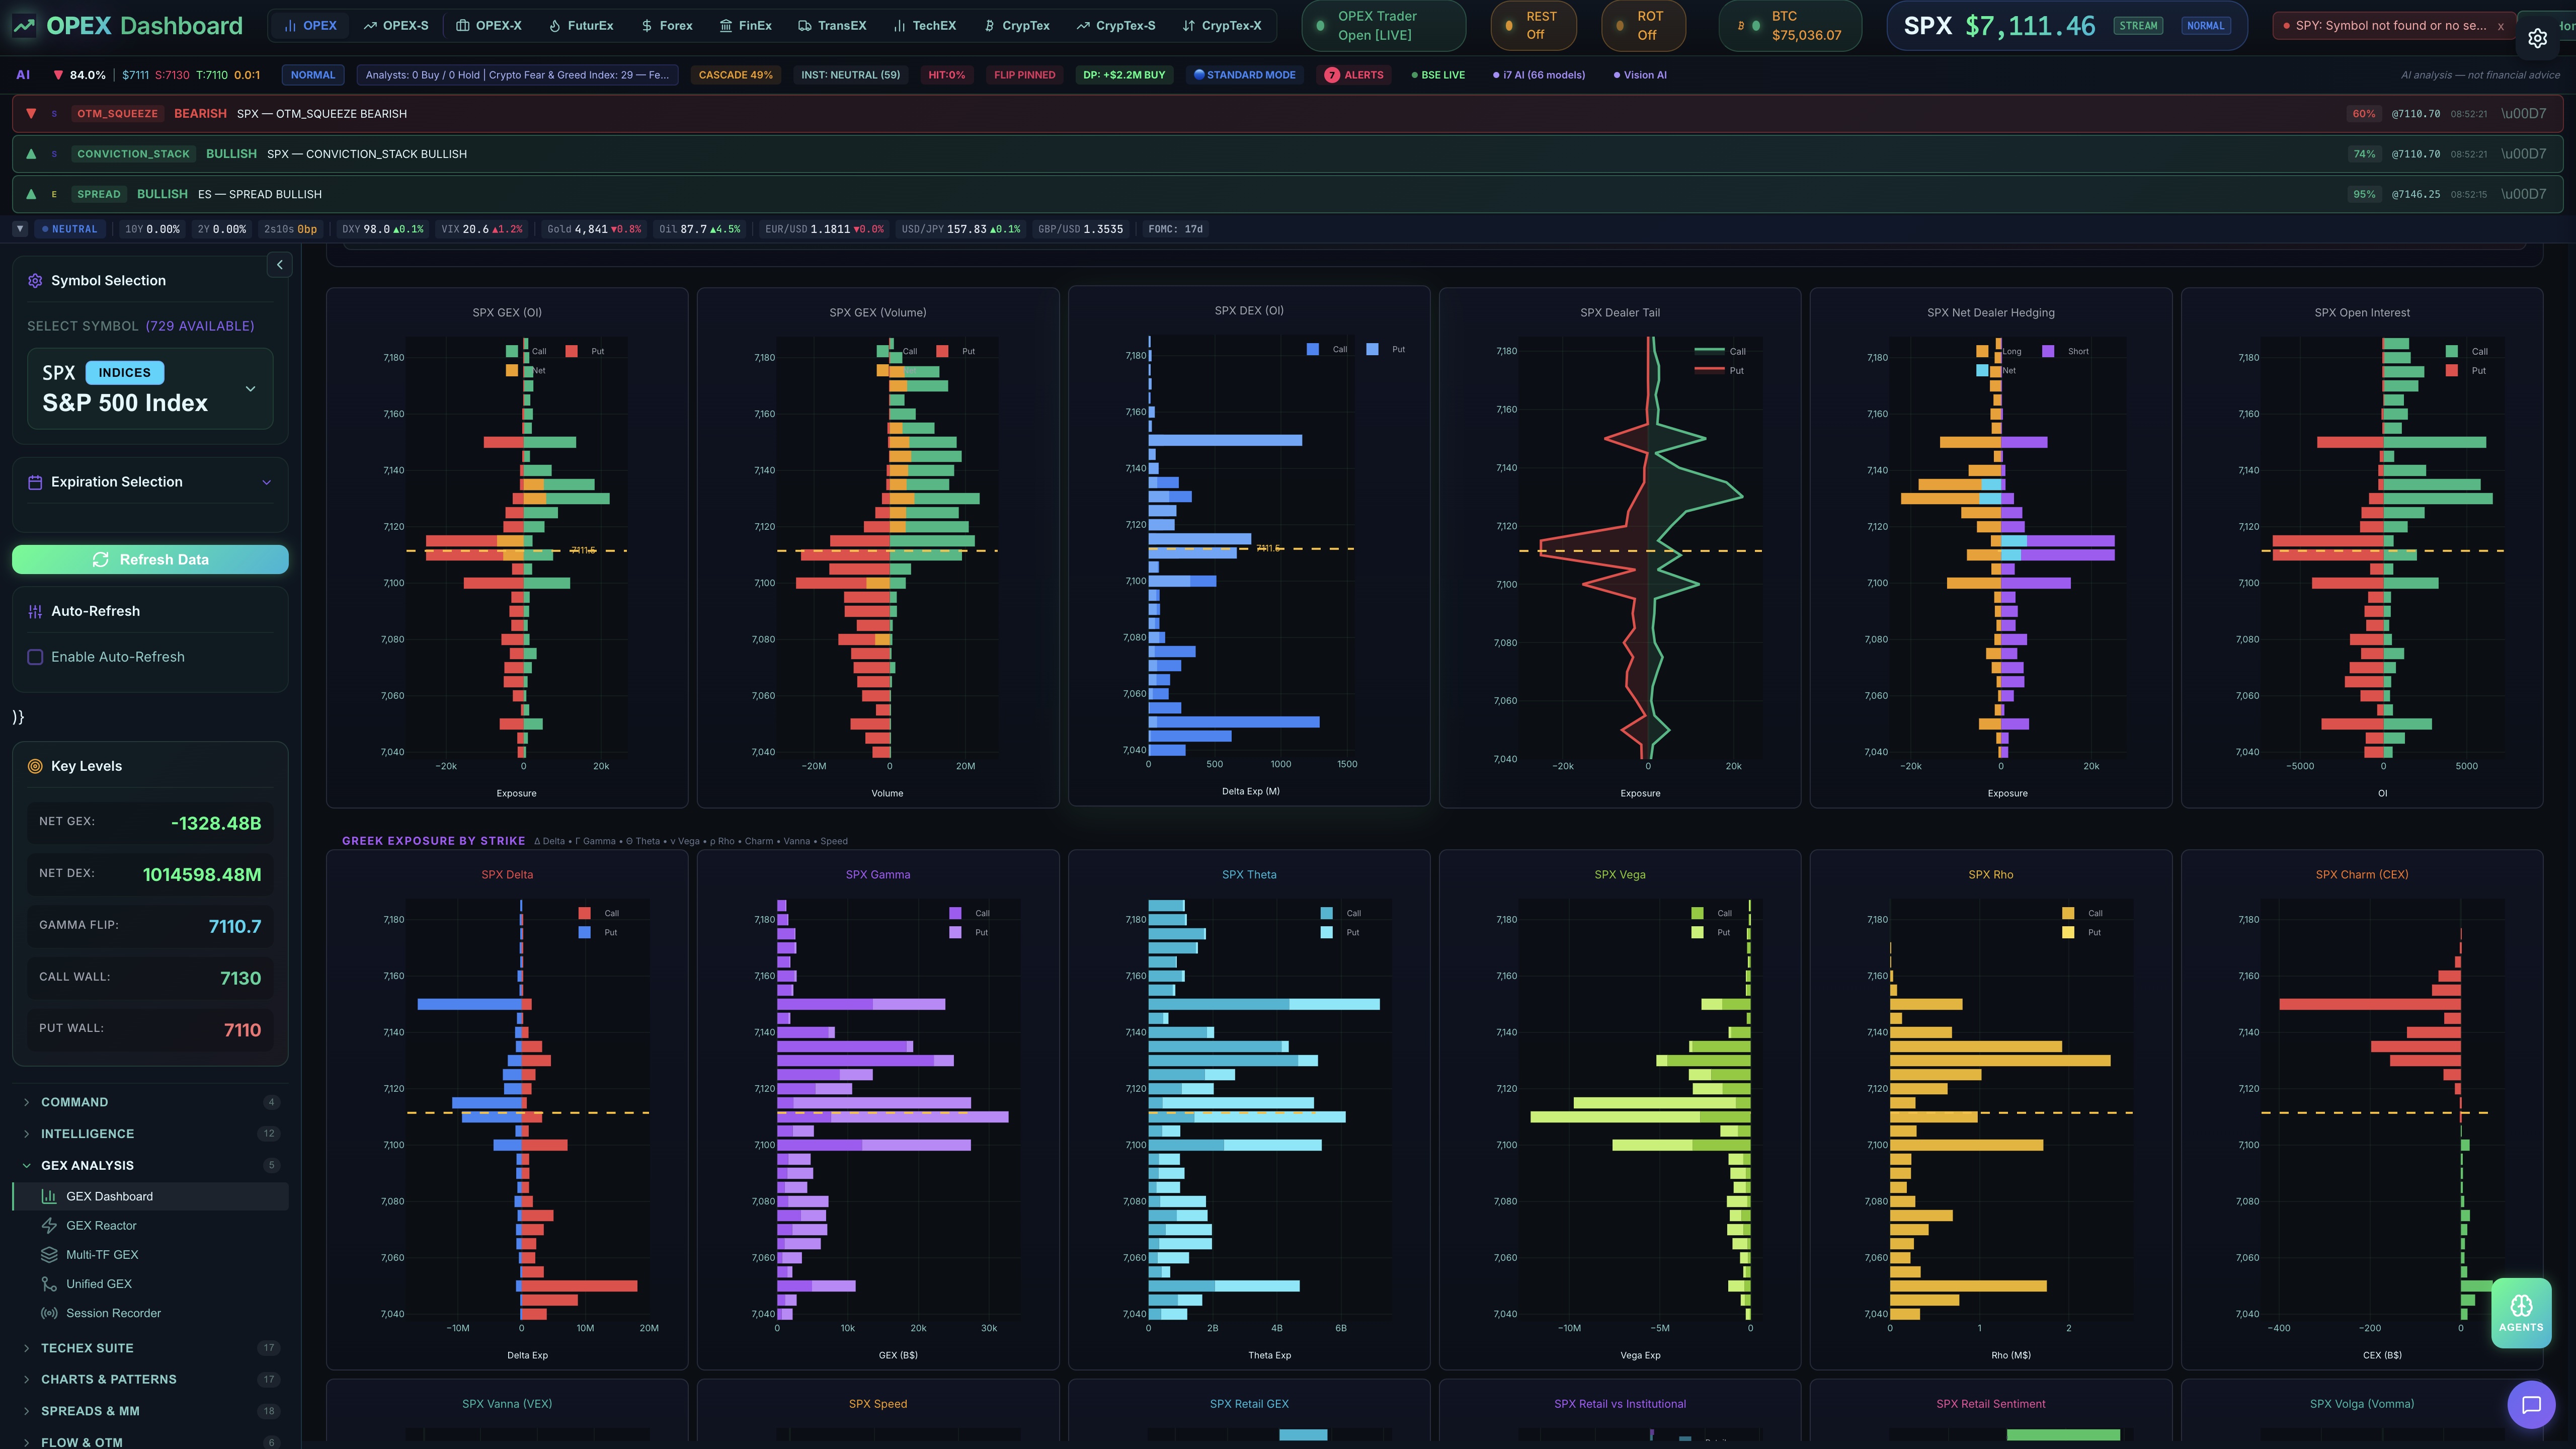
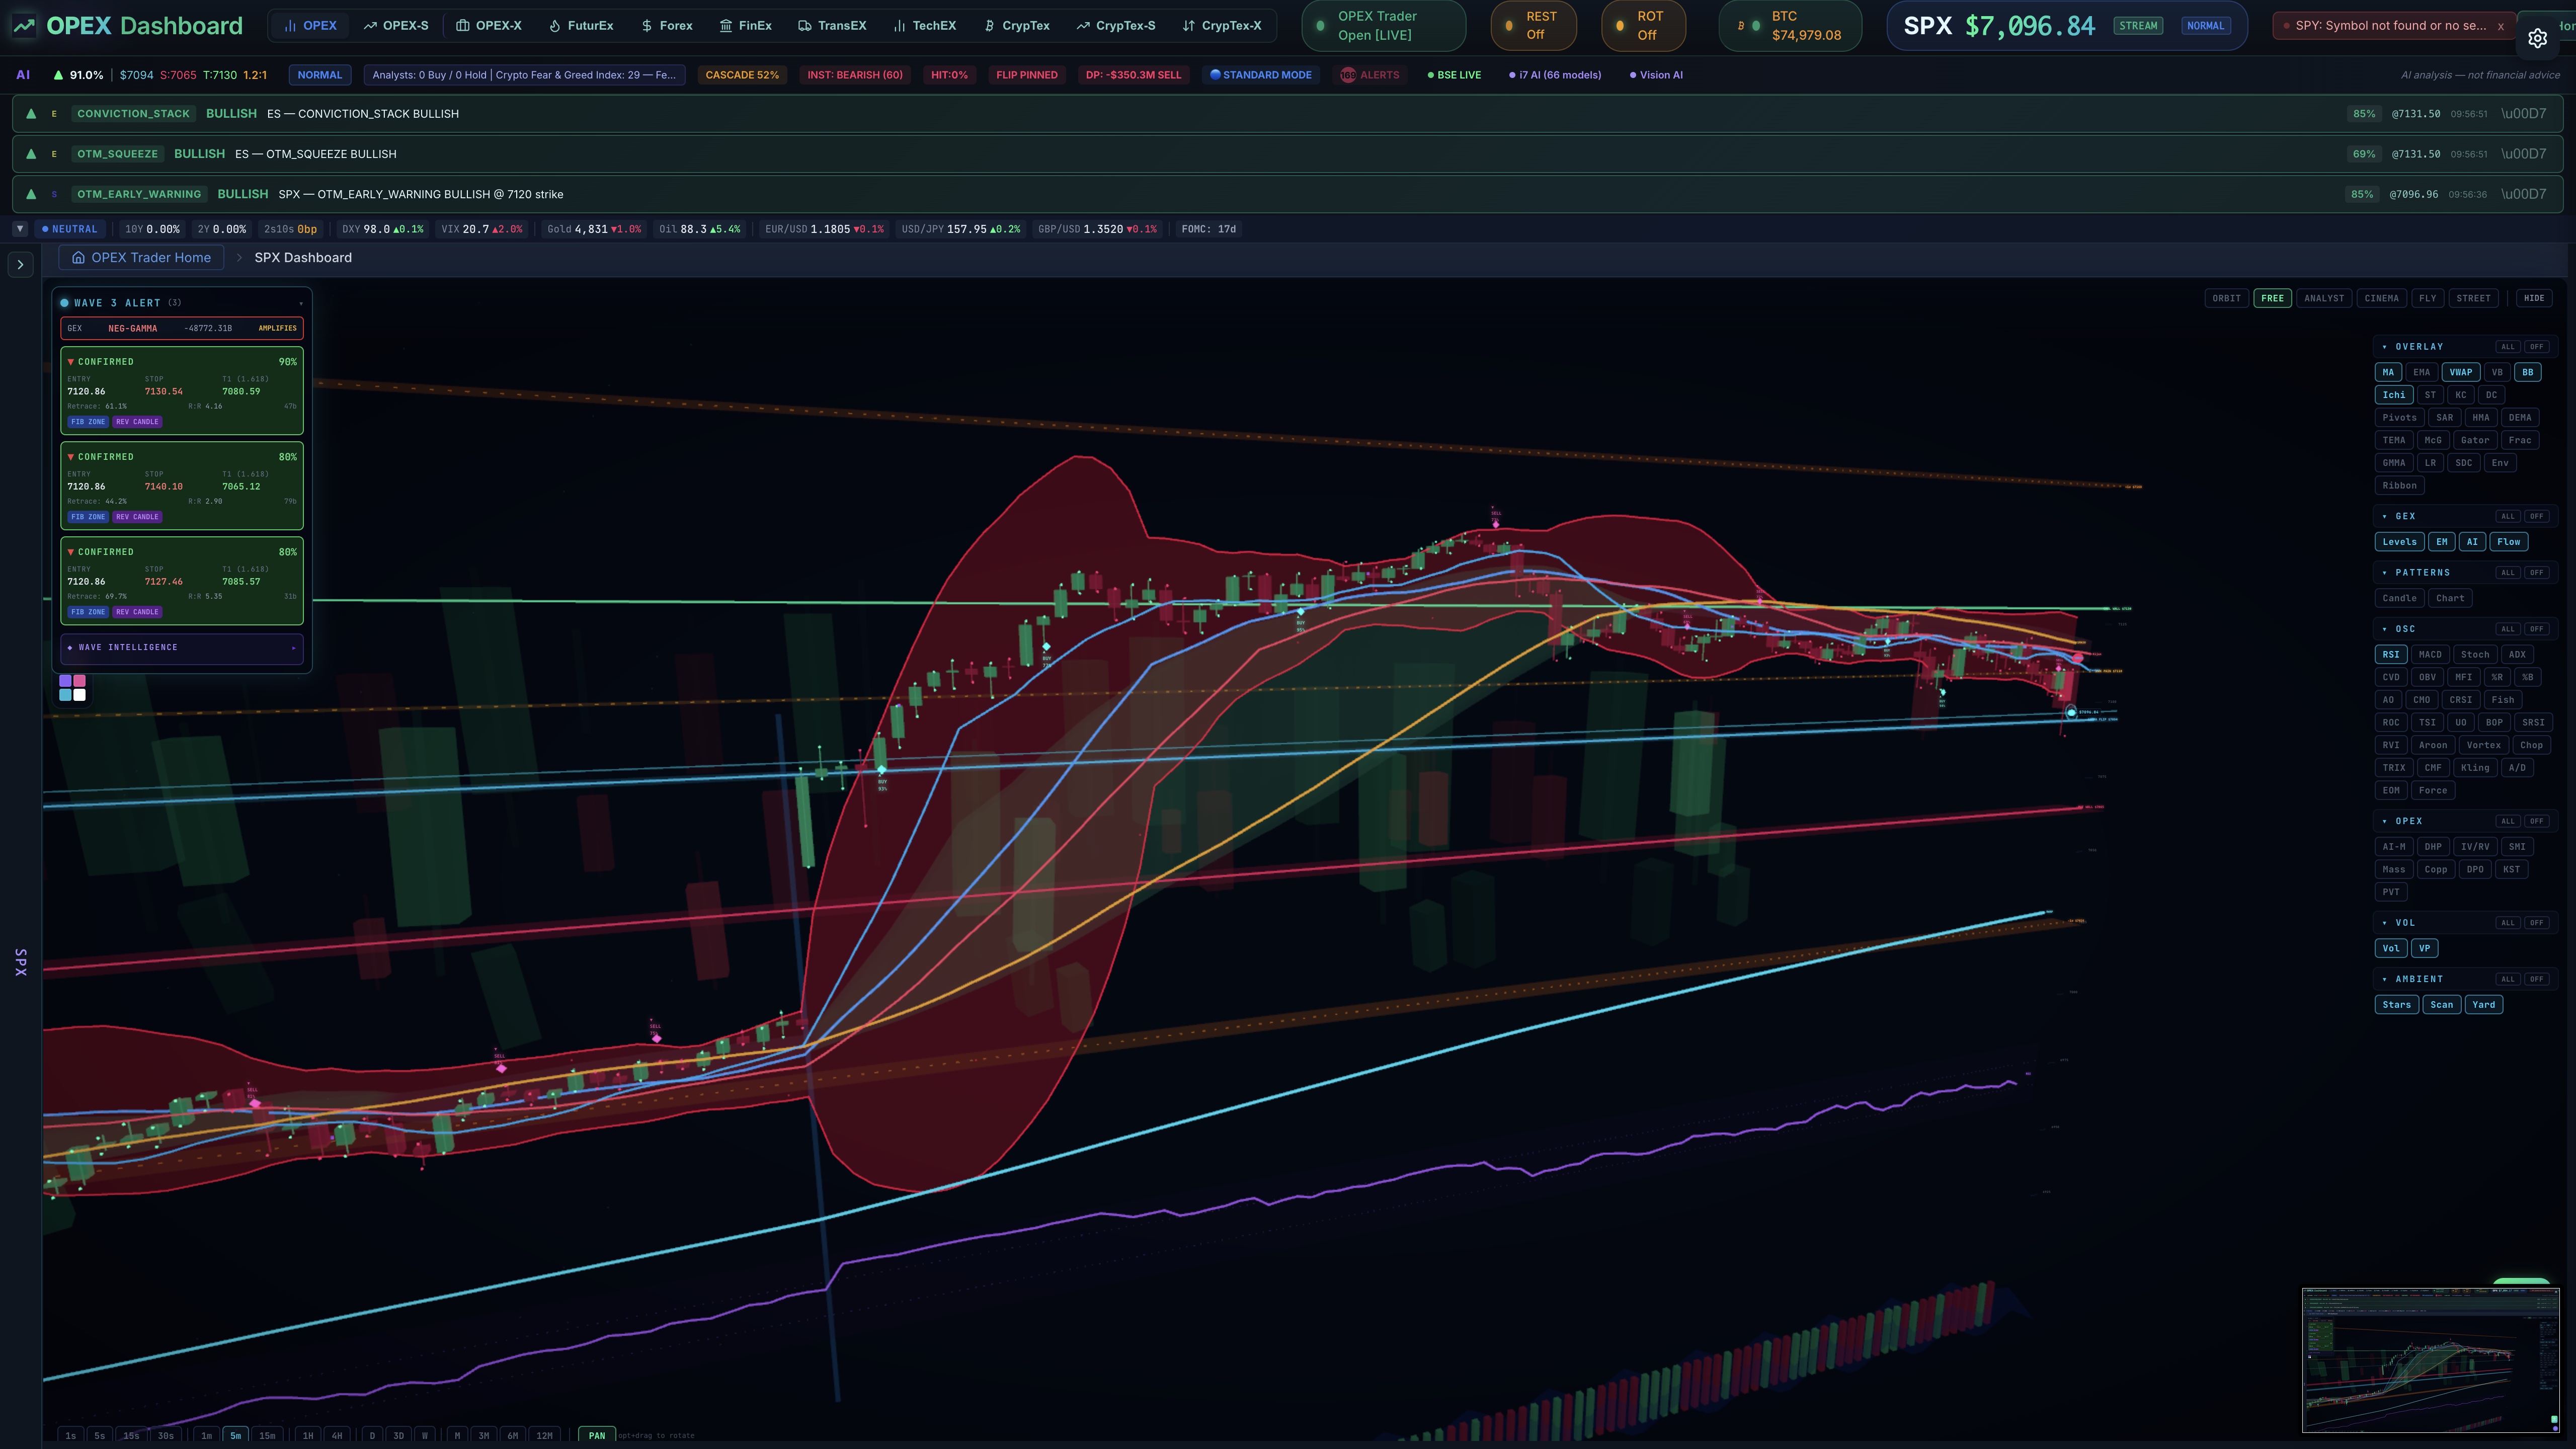
GEX Dashboard
Real-time gamma exposure with dealer hedging flows, cascade scoring, and vol regime detection across all expirations.
Options Chain
Full chain visualization with Greeks, OI analysis, institutional flow detection, and strike-level sentiment mapping.
Vol Skew Lab
Advanced skew methodology: 25D/10D skew surface, sqrt-T normalized skew, forward vol extraction, and calendar trade detection.
Vol Curve
Term structure analysis with normalized skew, forward volatility calculations, and z-score based trade signals.
Max Pain
Options expiration pain-point analysis with dealer positioning, pin-risk probability, and settlement price projections.
Spread Scanner & 3D Viz
Full lifecycle tracking across 27 spread types. 3D payoff surfaces with 7 time-anchored decay traces. Dominant spread detection with MM position analysis.
Dark Pool Intelligence
Off-exchange flow monitoring with block trade detection, dark pool sentiment, and smart money tracking.
Algo Scanner
Algorithmic order flow detection, sweep identification, and unusual volume alerts with institutional attribution.
MEI Perfection
Proprietary three-tier Market Efficiency Index. Calls exact macro tops and bottoms with 95%+ backtested accuracy. Blue MACRO BOTTOM. Purple MACRO TOP.
Kill Chain Generator
Auto-generates complete trade cards from signal clusters — strike, entry, target, stop, R:R, position size. Three chains: DEX, Flow, and Signal.
Spread Hierarchy Classifier
First-of-its-kind fractal spread structure detection. Maps micro diagonals to intra-hour condors to session-range structures with cycle phase prediction.
Algo Rhythm Tracker
Identifies the algorithm behind H&S, wedge, and triangle patterns. Cross-timeframe algo chain linking with apex countdown and breakout prediction.
Fractal Template Engine
Proves lower-TF Elliott Waves are geometric clones of higher-TF structures. Fibonacci ratio matching across timeframes with projected targets.
Liquidity Channel Engine
Auto-detects price channels with boundary touch signals. H&S/iH&S initiator mapping, apex projection, and break detection with volume confirmation.
Vision AI
Multi-model chart screenshot analysis via local Ollama pipeline. Self-validation engine cross-checks Vision AI findings vs. algorithmic scanners.
Risk Management Suite
Dynamic VaR, scenario analysis, portfolio stress testing. Risk Heatmap, Correlation Matrix, Liquidation Heatmap, and Market Regime Autopilot.
Signal Historian
150,000+ signal events with accuracy tracking at 15m/30m/60m windows. Per-signal-type breakdown, missed move detection, and weekly recommendations.
Backtesting Engine
Test any strategy against historical data. Equity curve, Sharpe ratio, Kelly Criterion sizing, max drawdown, and multi-strategy comparison.
OpexView Pro Chart
GPU-accelerated 2D charting via TradingView LWC v5. 28 overlay toggles, 5 oscillator sub-panes, 15+ drawing tools, 4 chart types, multi-chart layouts, real-time GEX zone overlays.
OpexView Nova (3D)
The world's first true 3D interactive trading chart. 75+ indicators as holographic 3D objects. 4 camera modes. Bloom post-processing. 4,372 lines. Dual editions: GEX Edition (Call Wall, Put Wall, Gamma Flip beams) and Spot Edition (SMA/Fibonacci/VWAP beams, pattern markers — no options needed).
Elliott Wave Scanner
7-module analysis: impulse detection, corrective waves, multi-TF fractal nesting, Wave 3 accumulation, spread correlation, GEX/Greeks predictive signals, AI auto-interpretation.
Liquidity Zone Engine
Crown jewel: dual interlocking H&S/iH&S universal market algorithm. Liquidity Zone Map, Rhythm Meter, Interlocking Algo Wedges with apex detection, Cascade Alerts, Multi-TF Grid.
GEX+DEX Alpha Scanner
Triple Bear/Bull setup detection combining gamma exposure, price at Call/Put walls, and dealer delta hedging. Confidence scoring 0-100%. Validated at 70%+ for intraday reversals.
God Stack AI System
7-tier model routing across 87+ Ollama models. Commander (32B), Director, Analyst, Support, Vision, Quant, Dev tiers with VRAM-aware queue management on dedicated GPU.
AI War Room
4 parallel agents debate every trade: GEX Analyst, Pattern Analyst, Risk Analyst, Strategy Analyst. Synthesis verdict from Commander. UNANIMOUS / STRONG / MAJORITY / SPLIT scoring.
OTM Flow Scanner
Institutional OTM activity detection with momentum filtering, sweep velocity tracking, accumulation detection. Spread Build Detection distinguishes directional flow from spread legs.
Institutional Footprint Tracker
Block trade detection, sweep monitoring, and smart money ratio analysis. Surfaces repeat-strike accumulation patterns as they form.
Mobile Ready
The full 390+ tab OPEX experience on Android. Cloud-powered data — no broker account required for mobile.
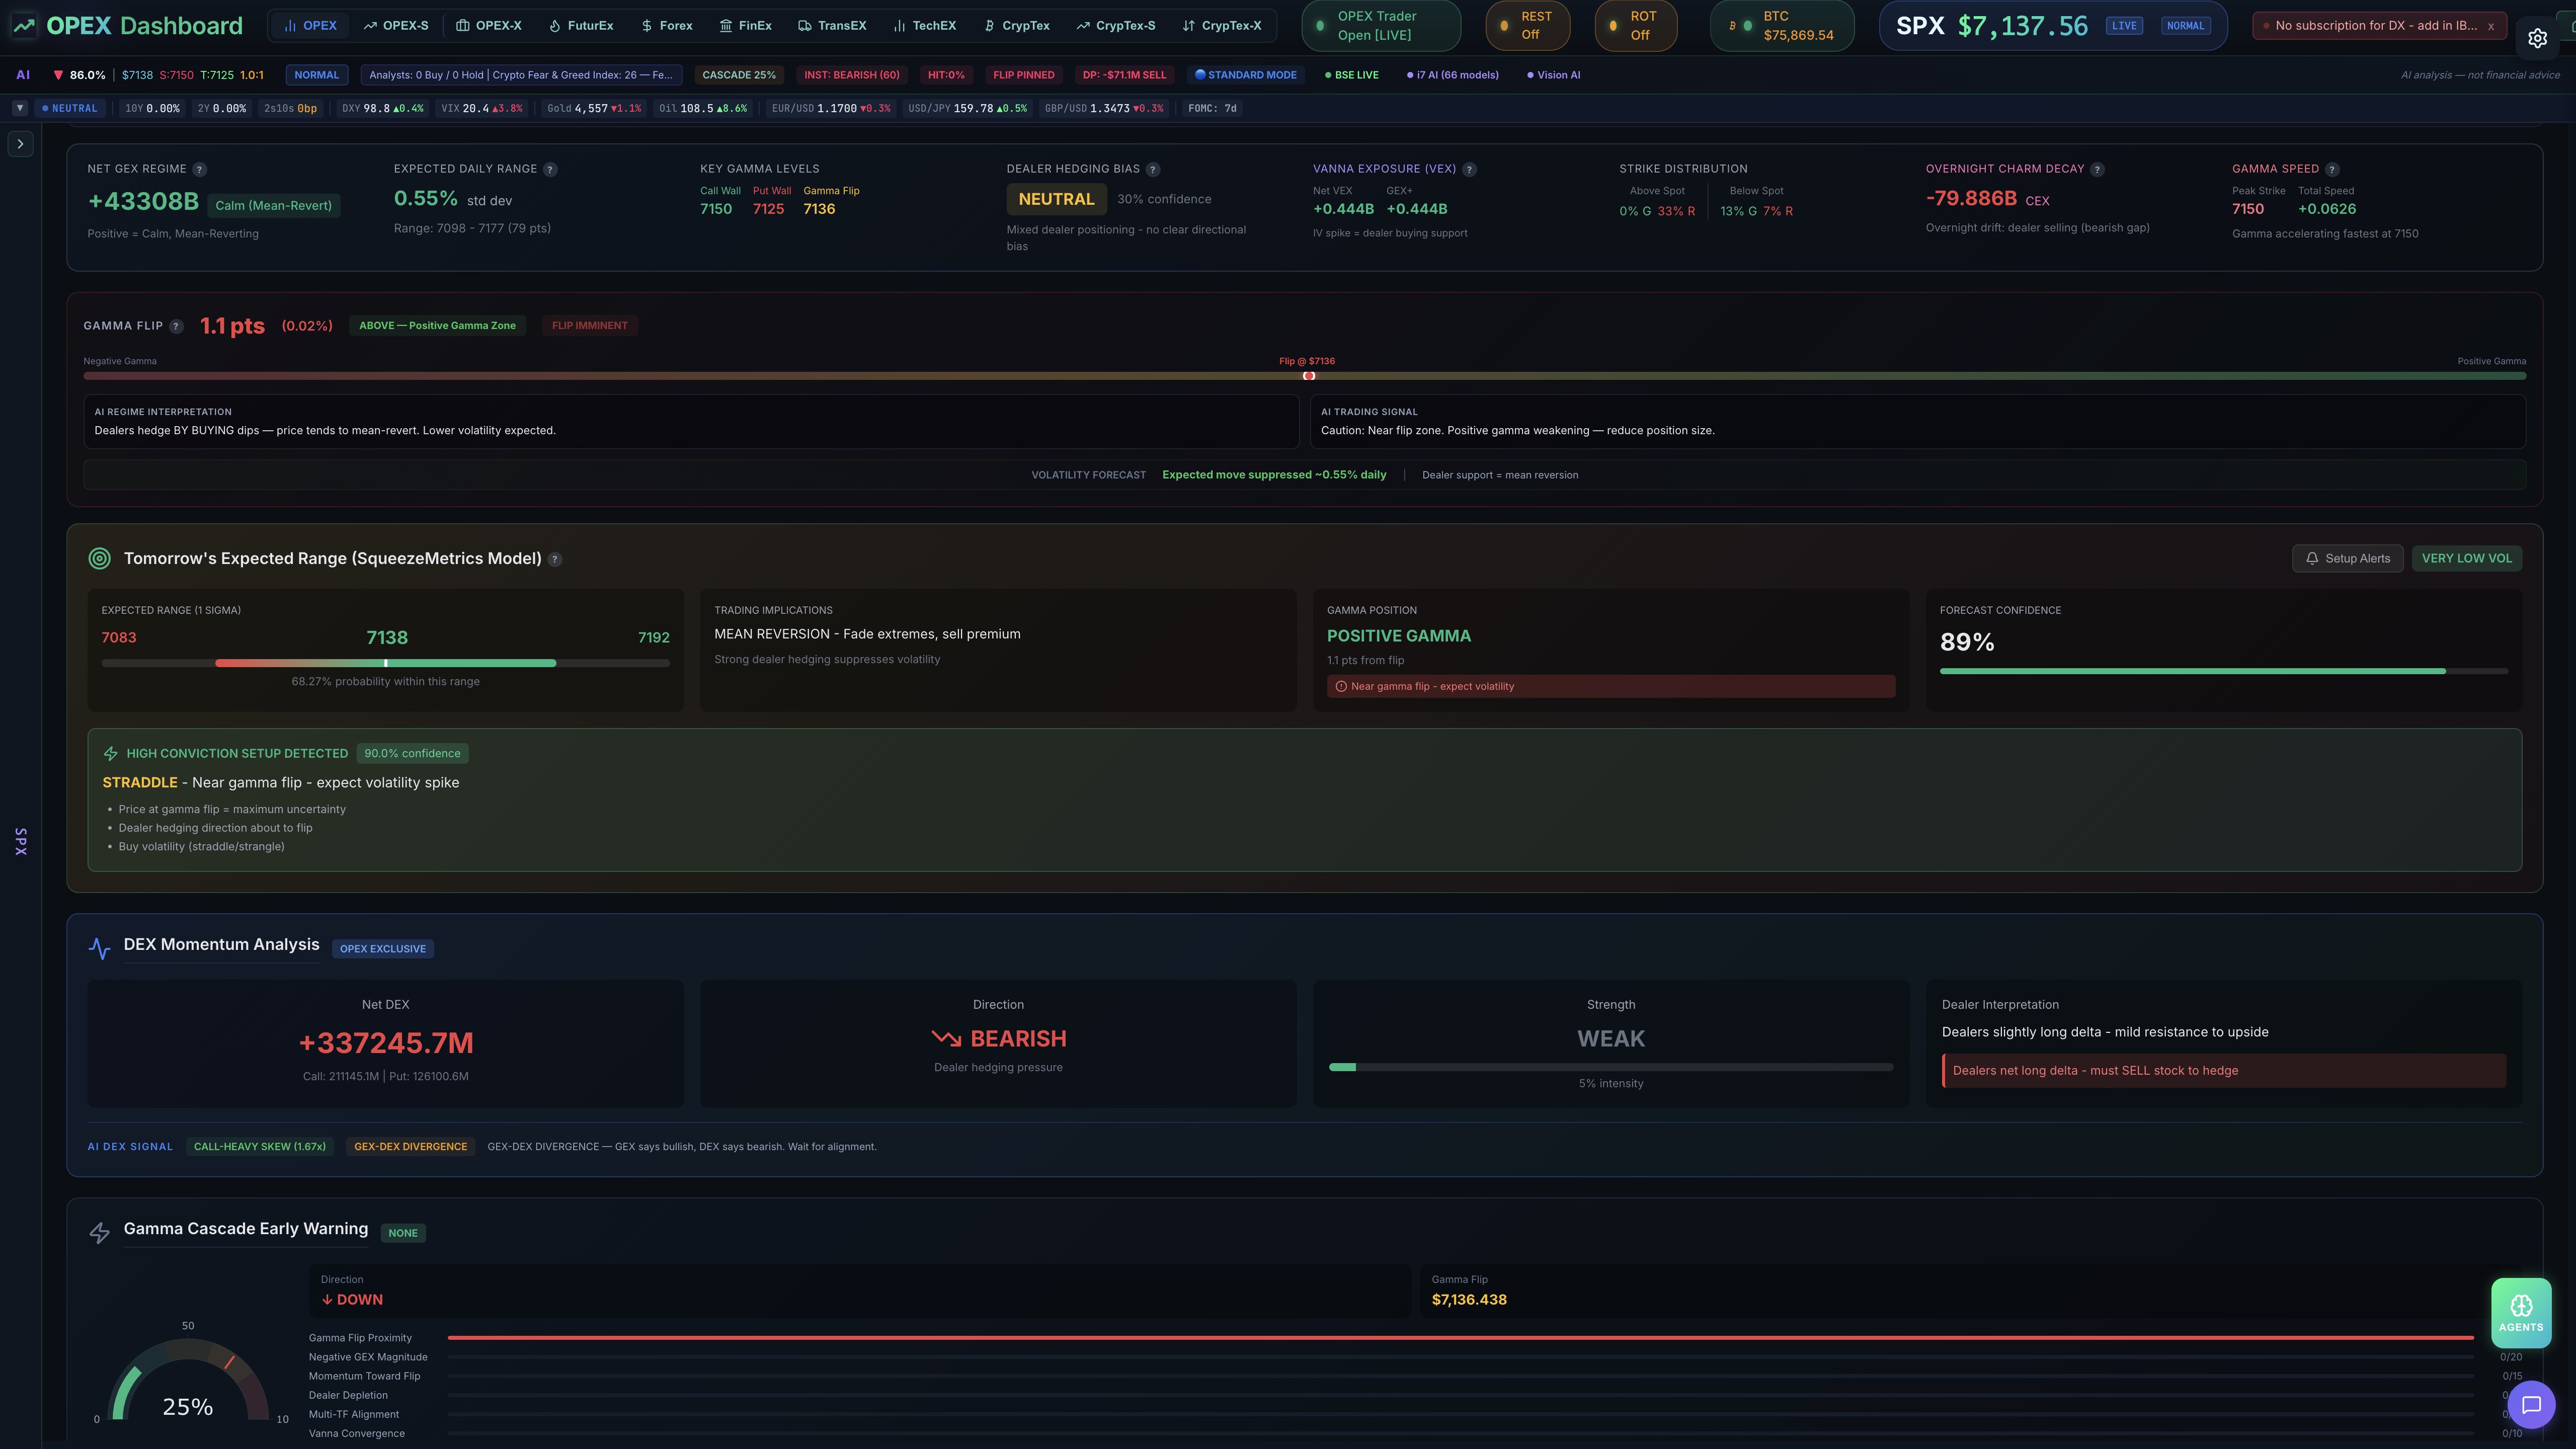
GEX Command Center — DEX & Gamma Cascade
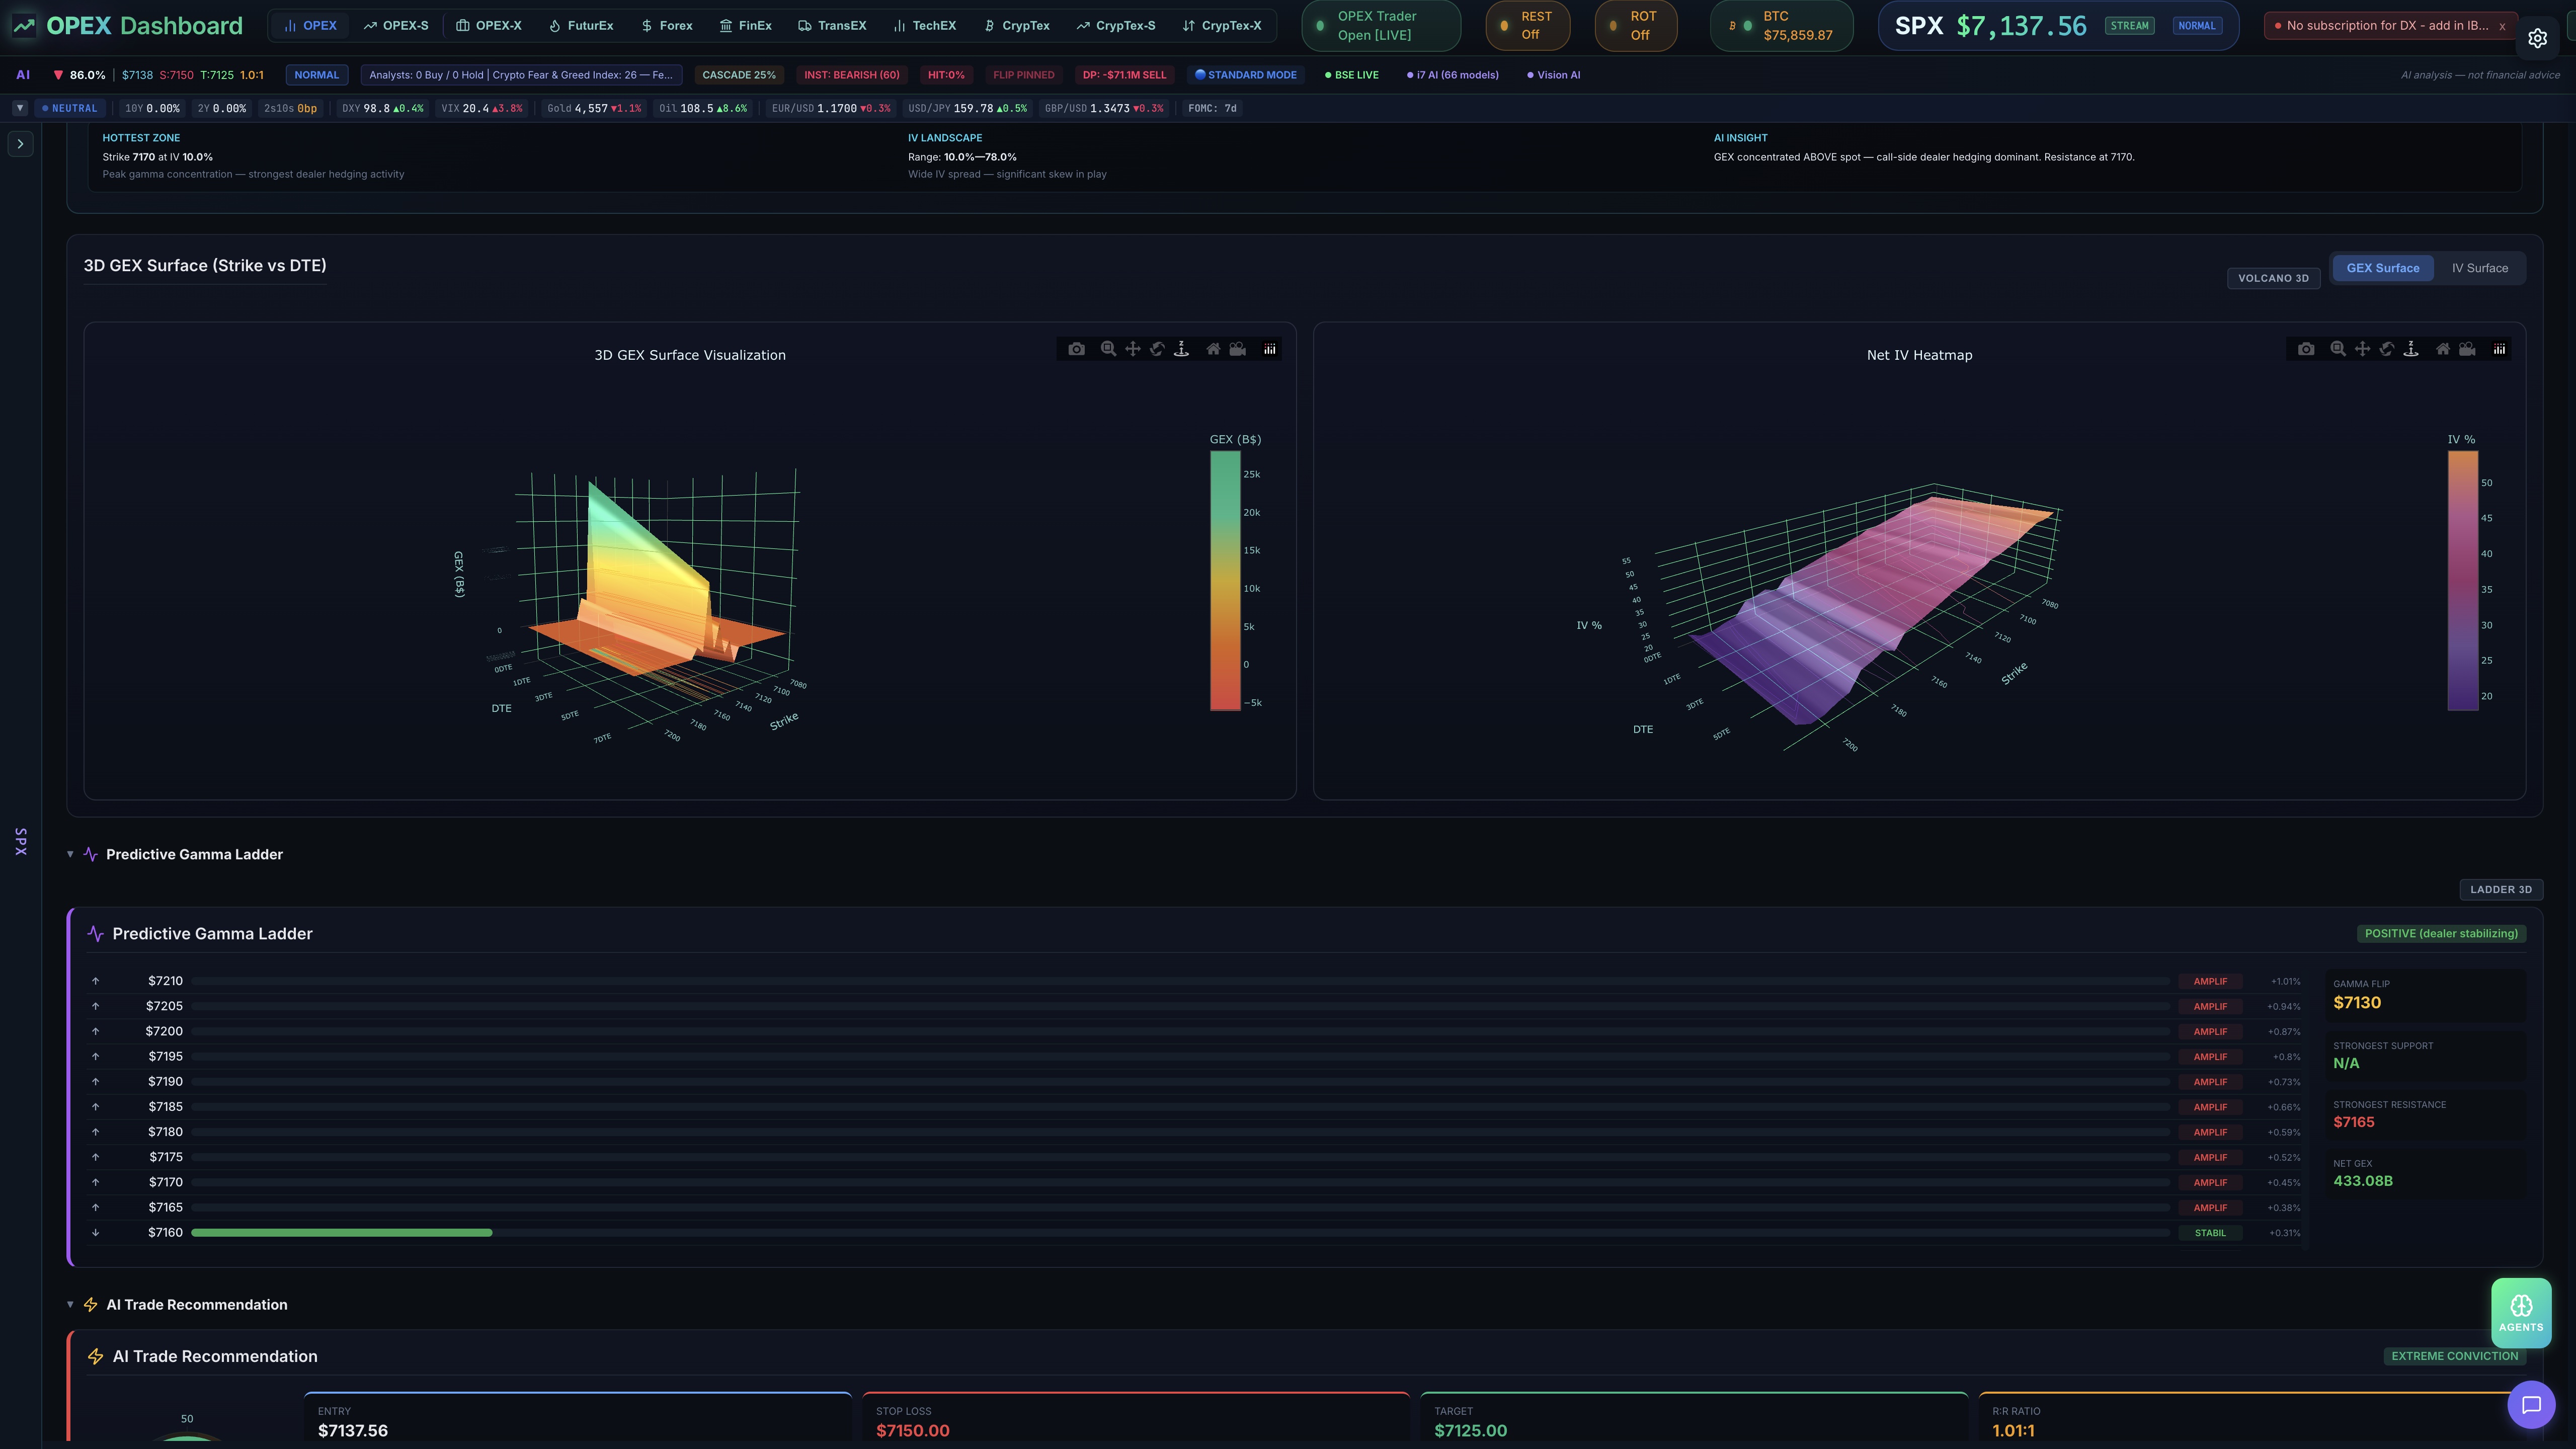
3D GEX Surface & Predictive Gamma Ladder
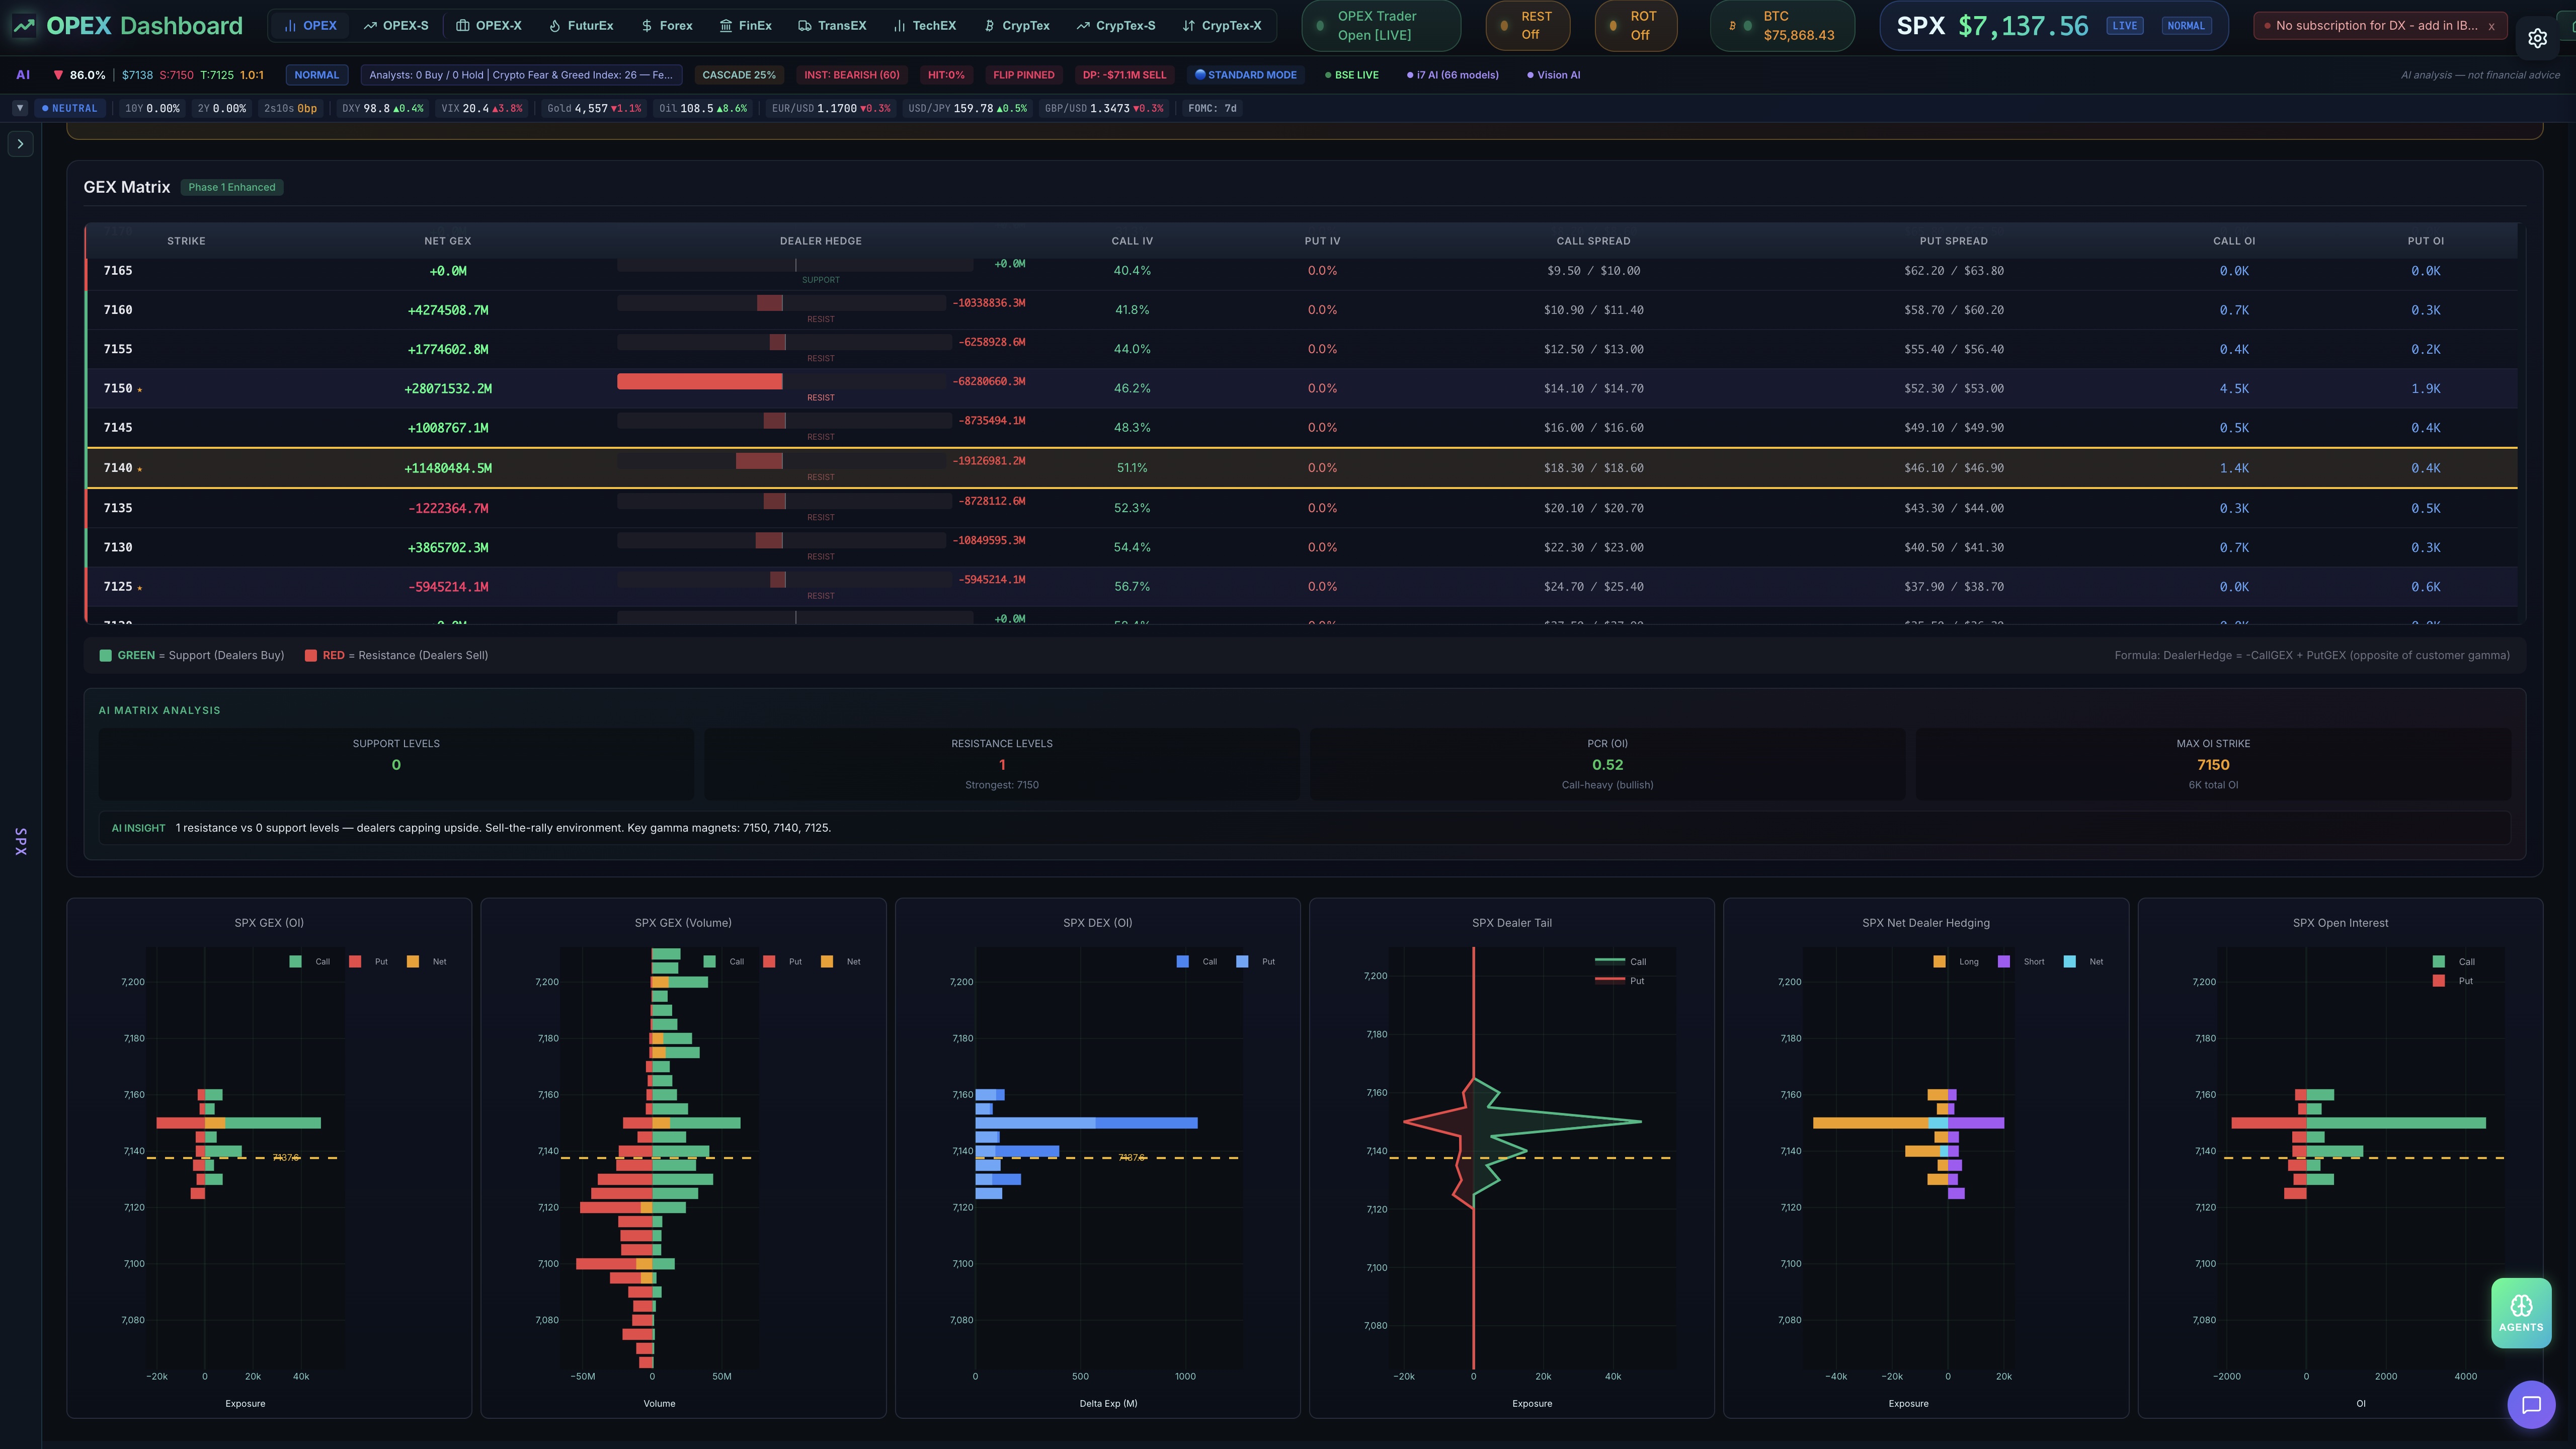
GEX Matrix & Strike Distribution Charts
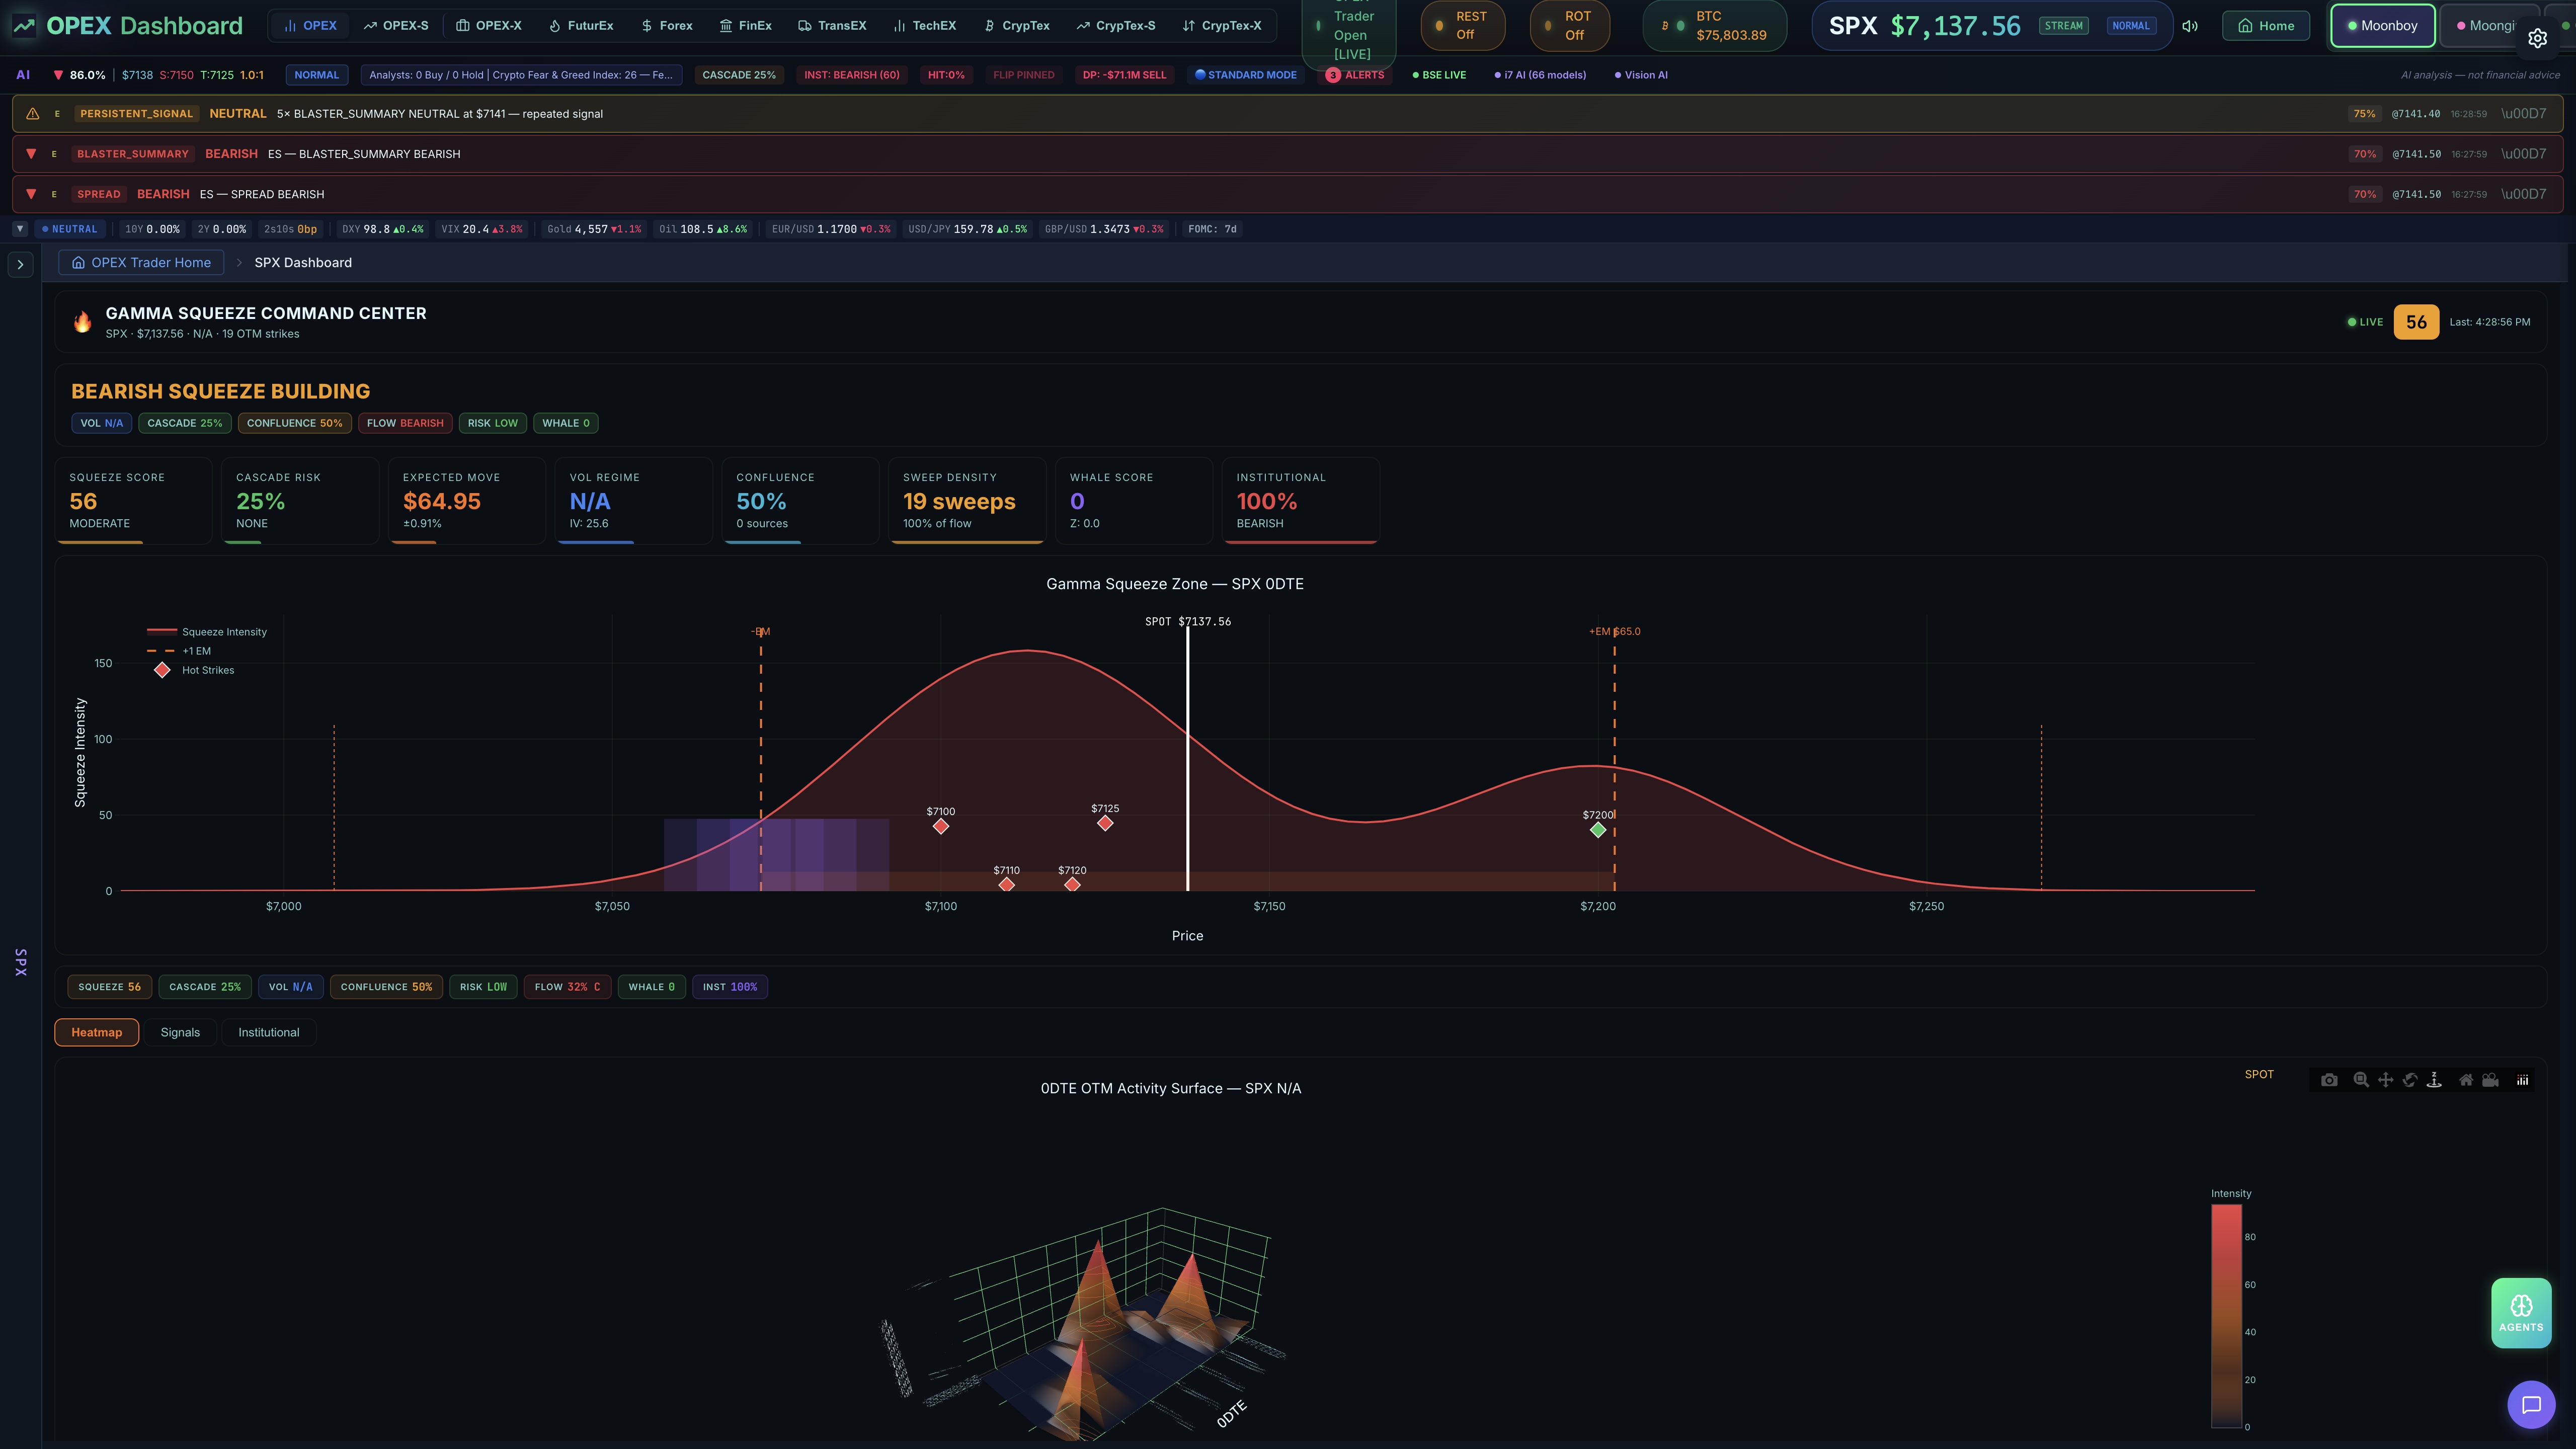
Gamma Squeeze Command Center
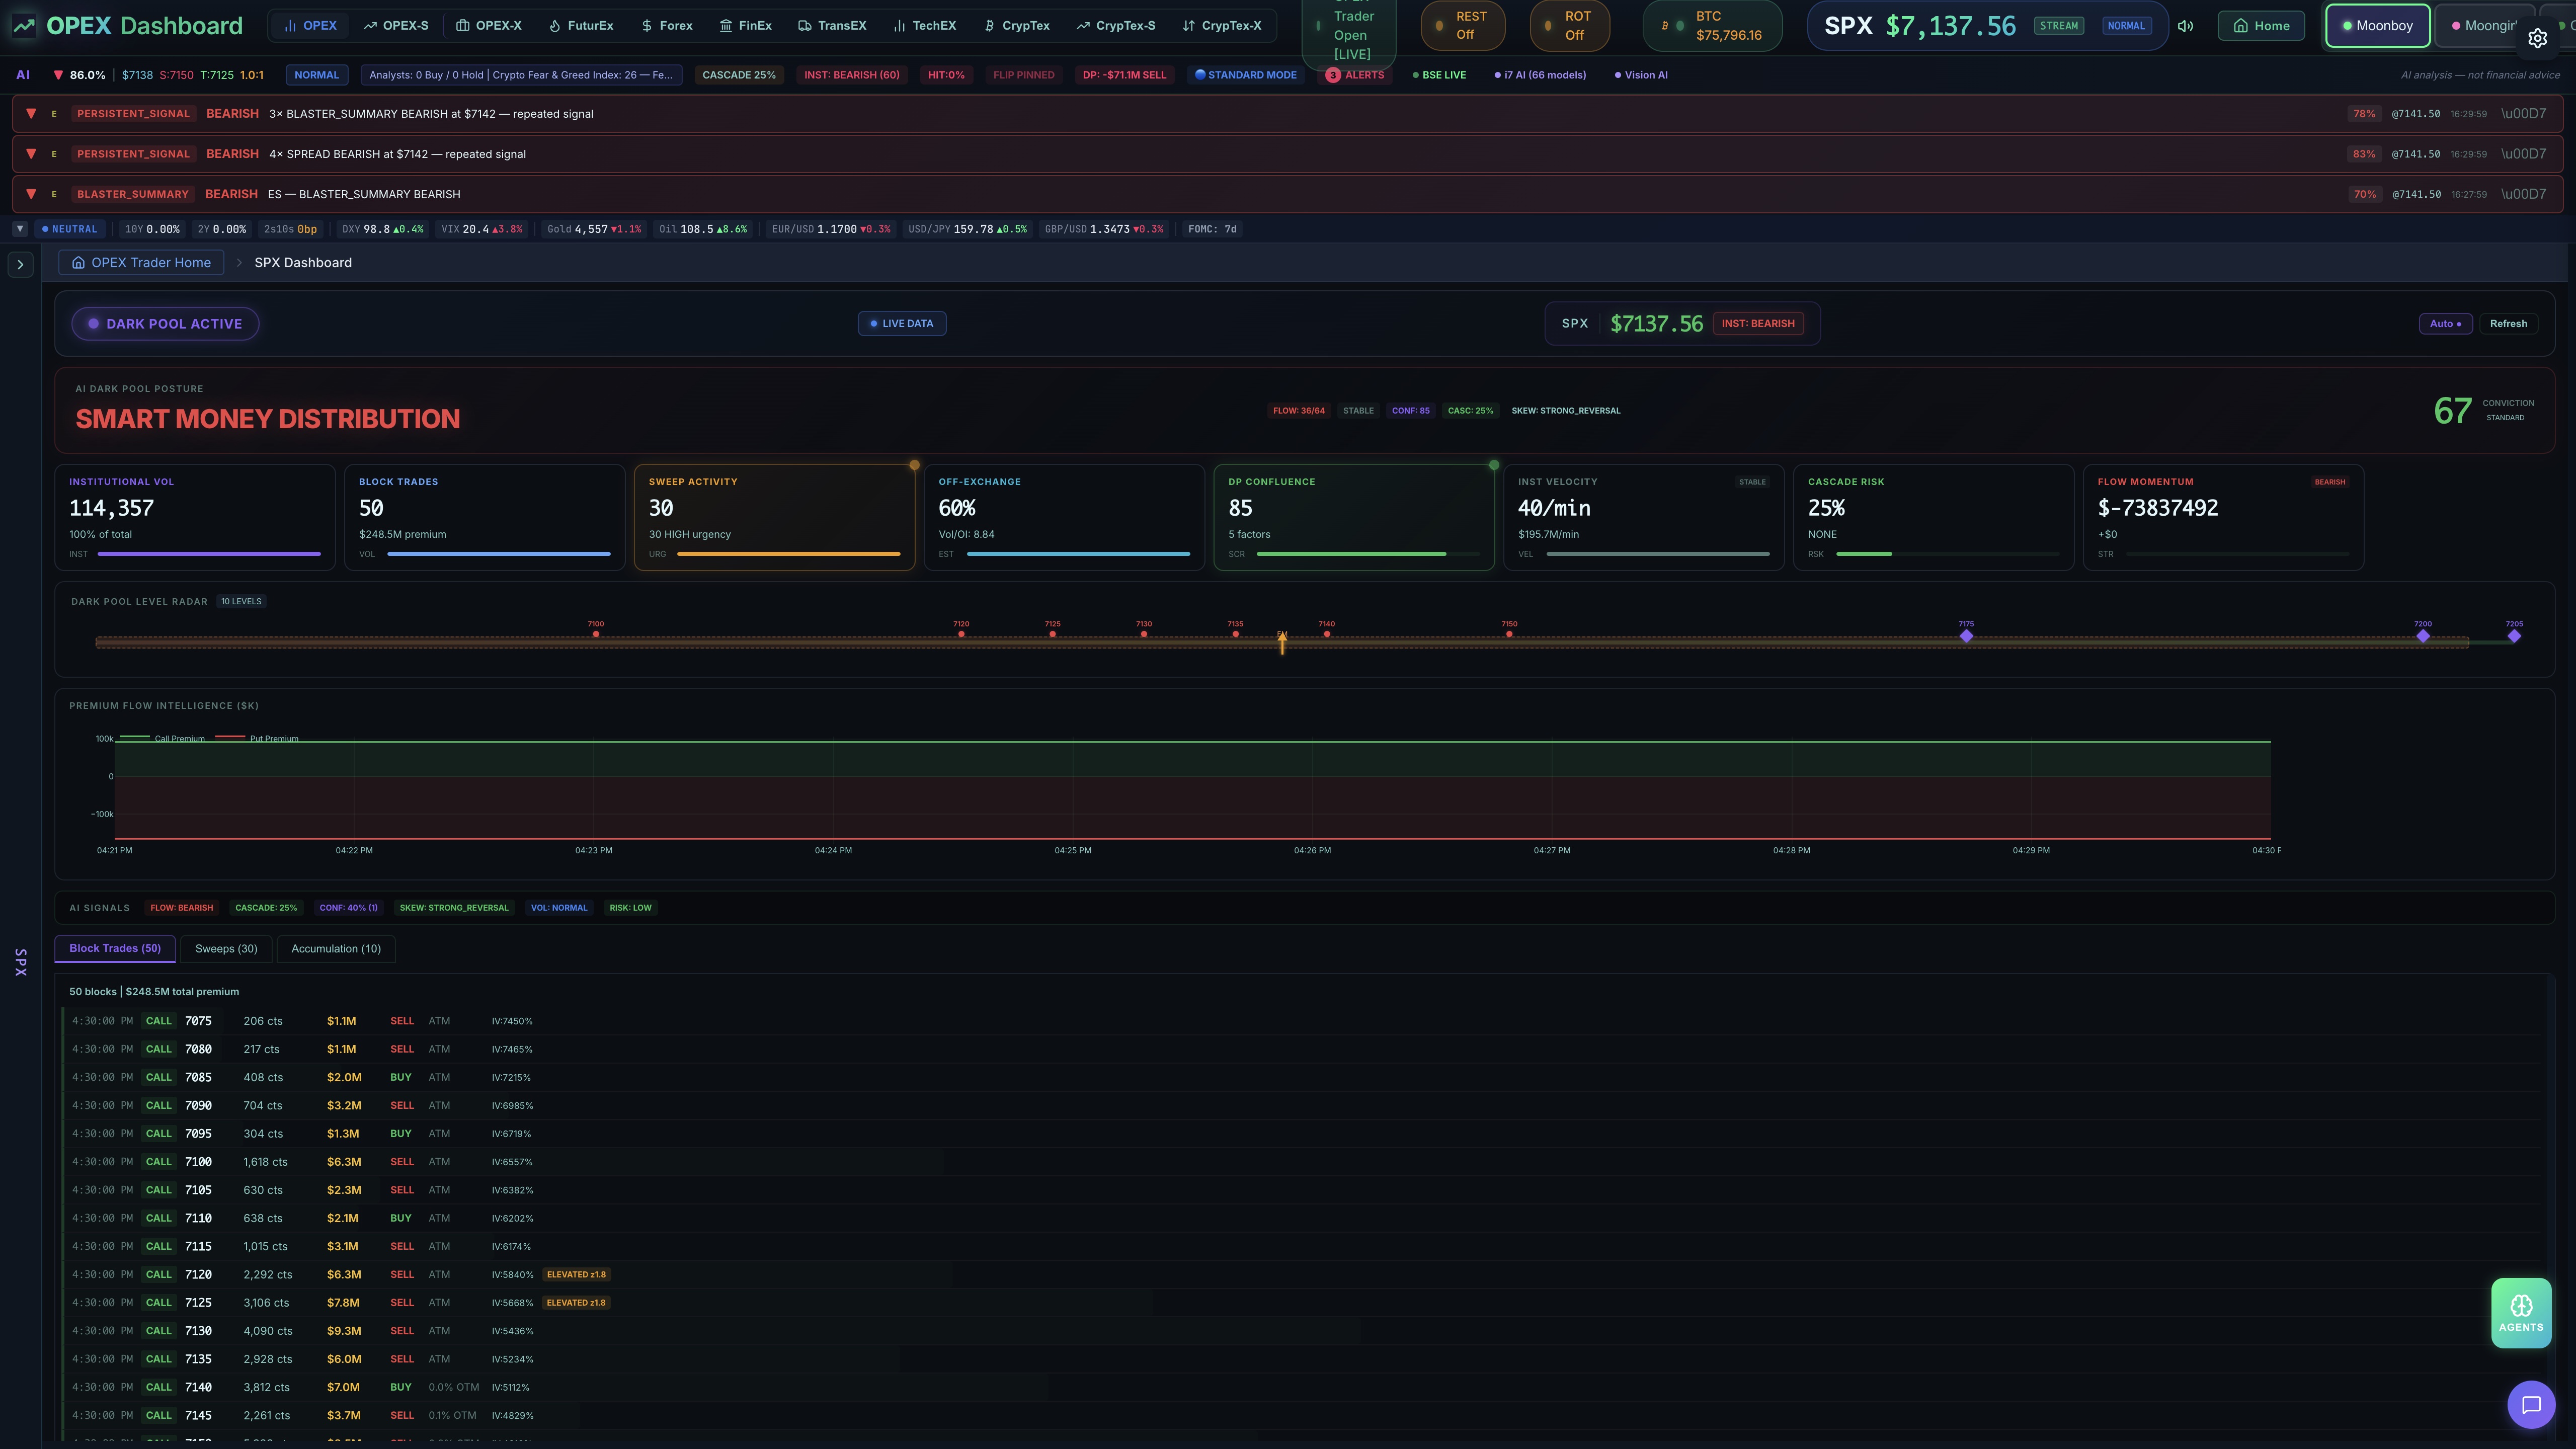
Dark Pool — Smart Money Distribution
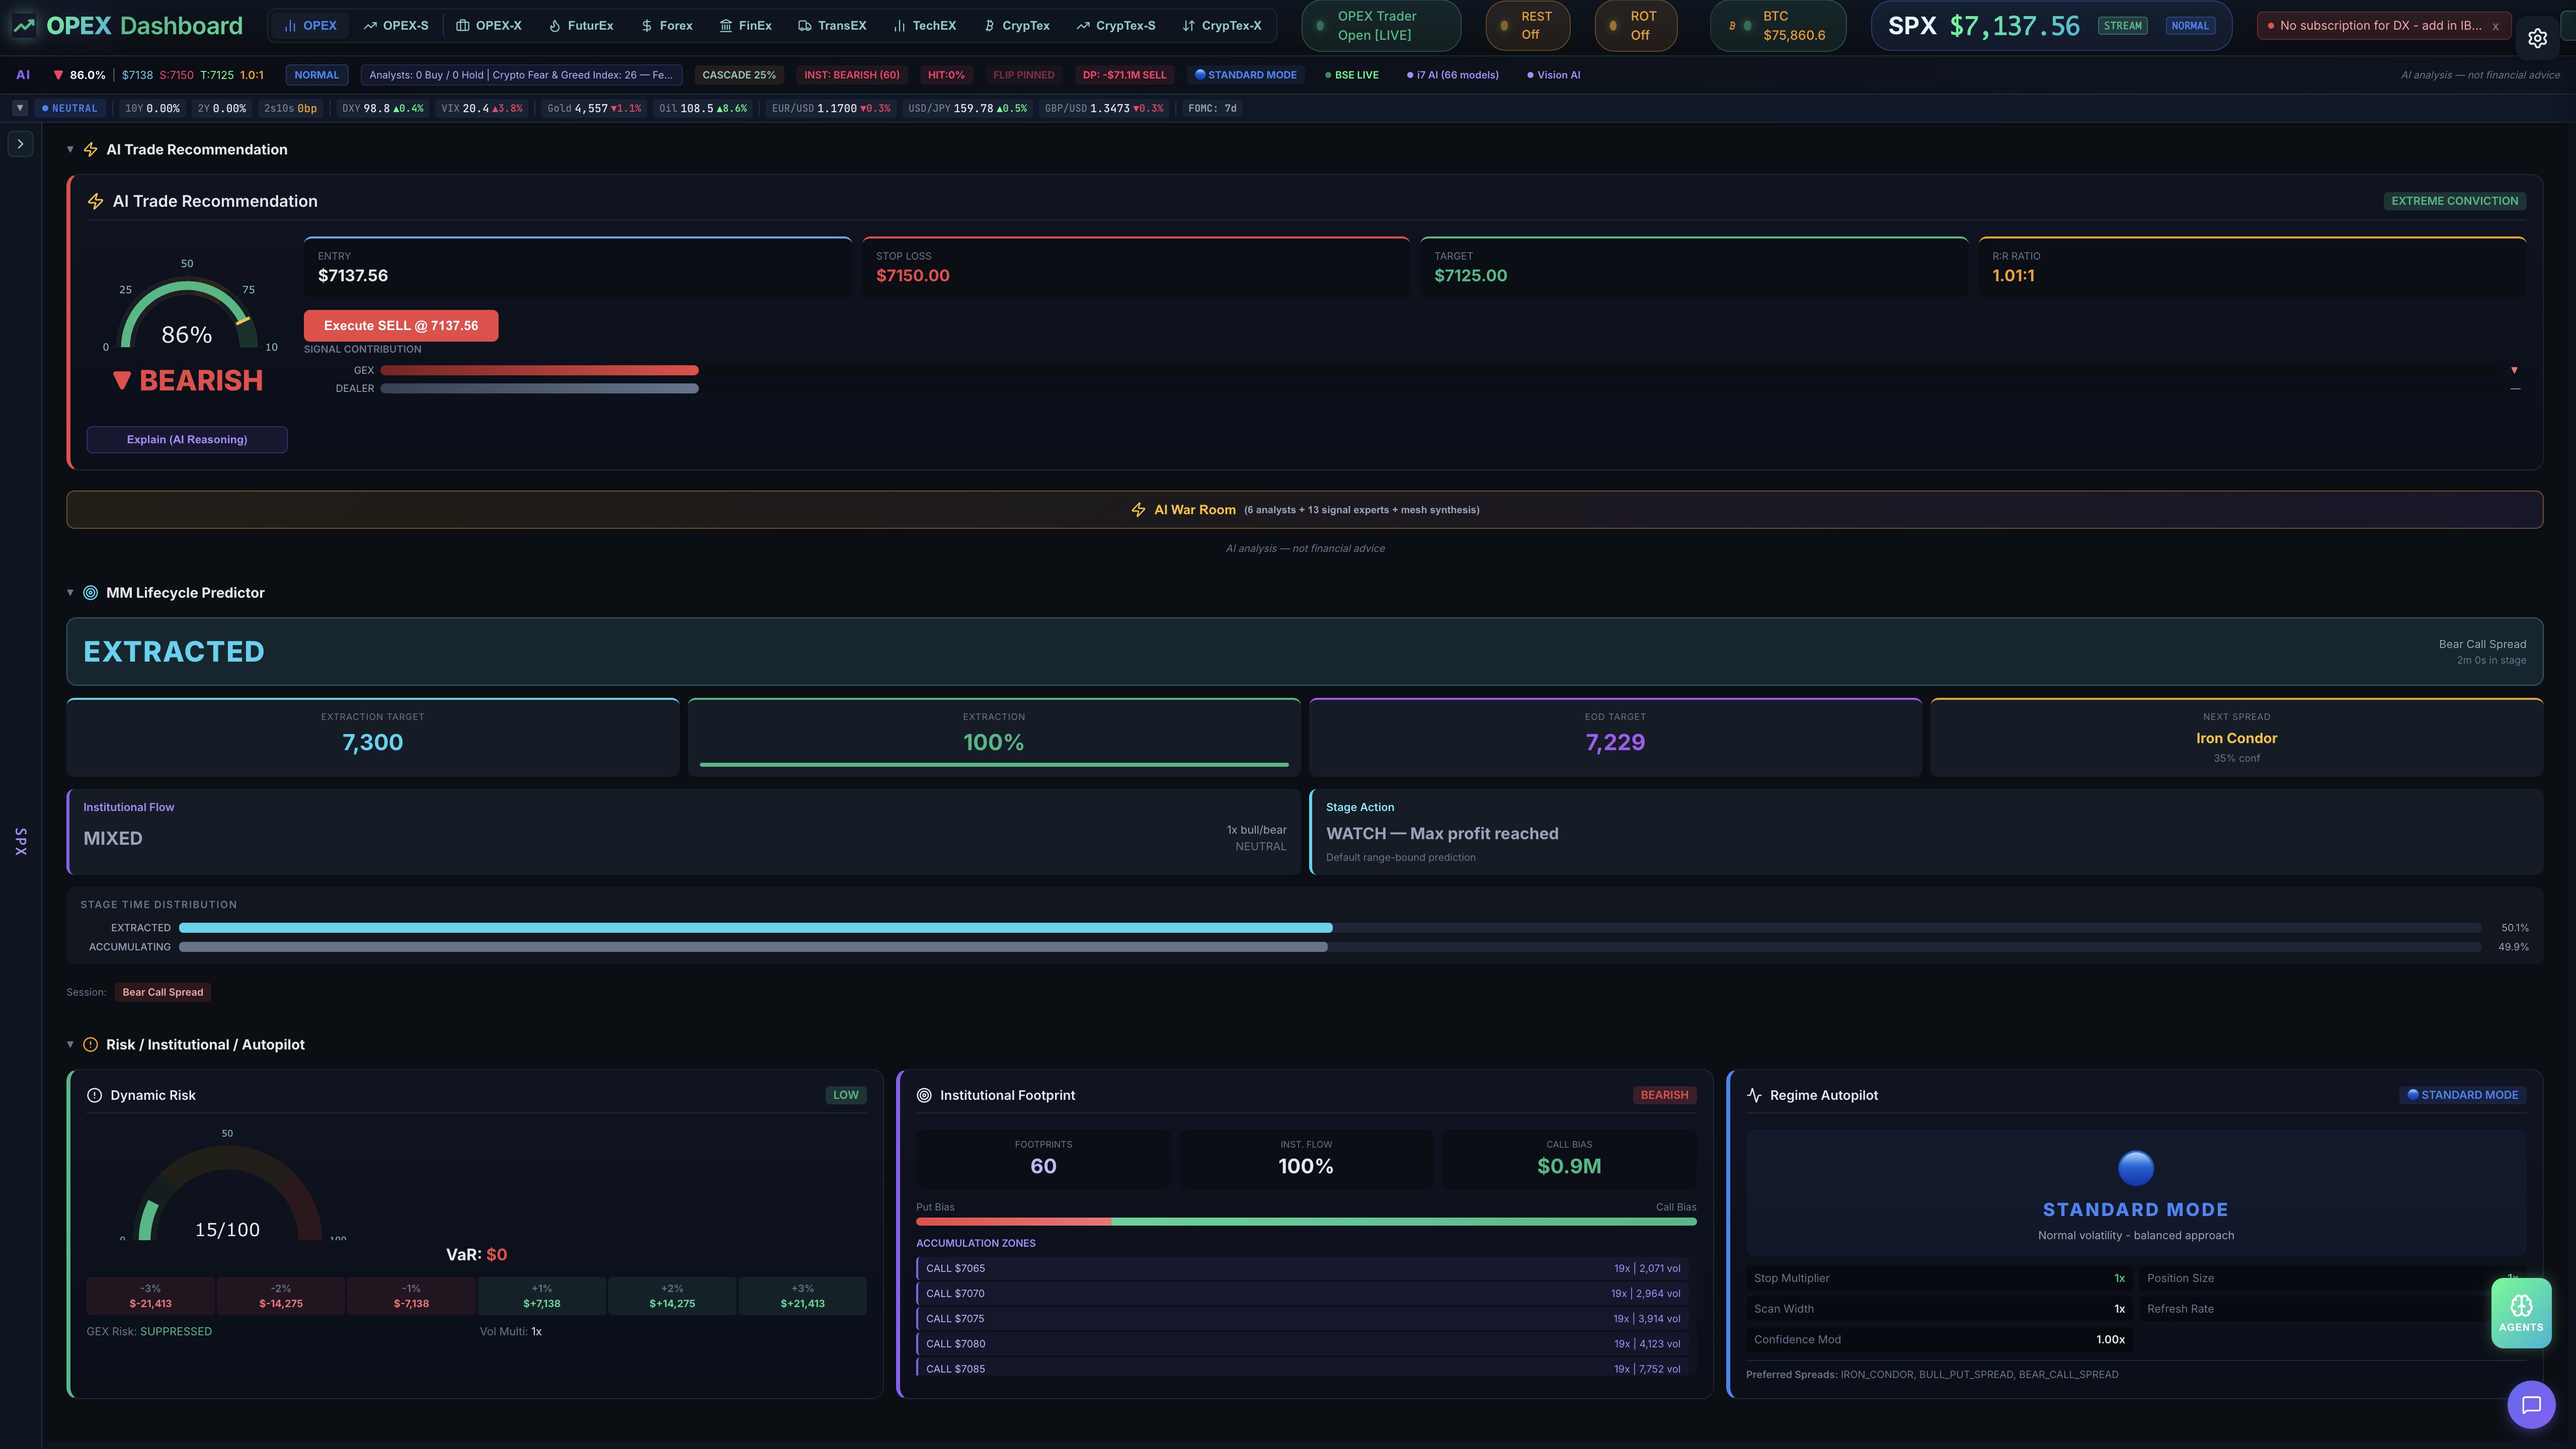
AI Trade Recommendation & Risk Autopilot
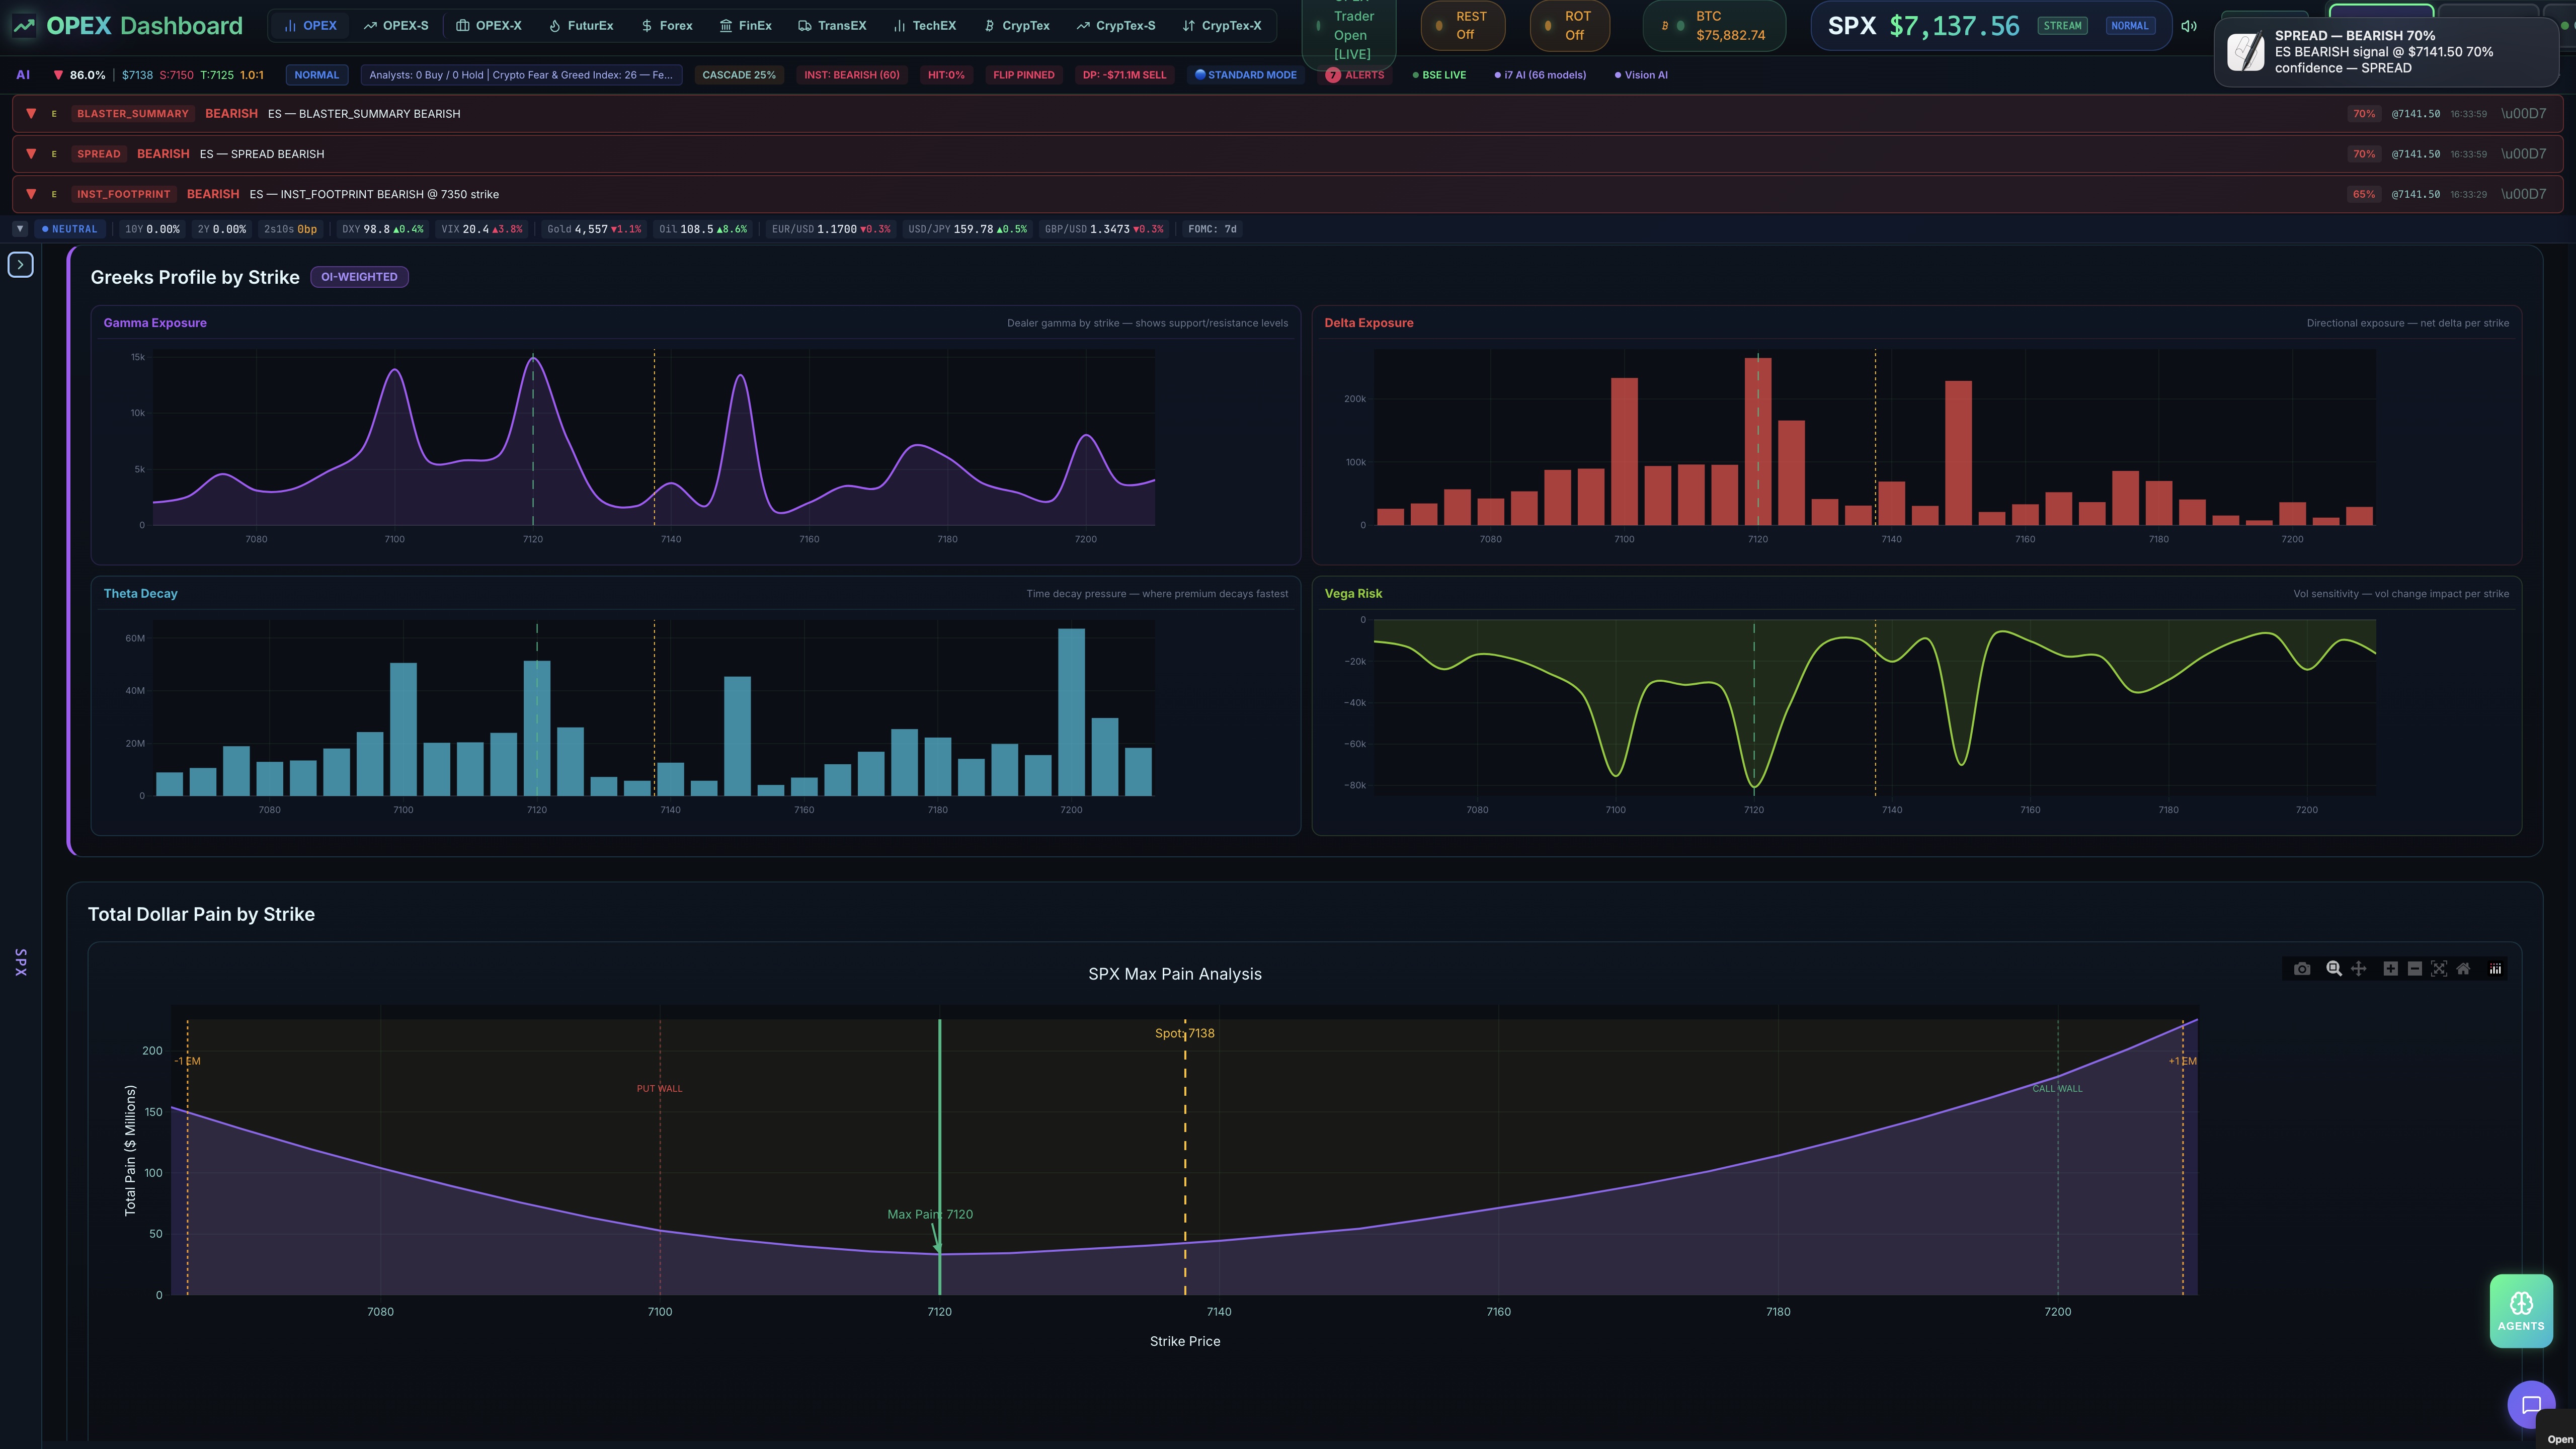
Greeks Profile by Strike & Max Pain Analysis
Greeks Multi-Panel — 12 Distribution Views
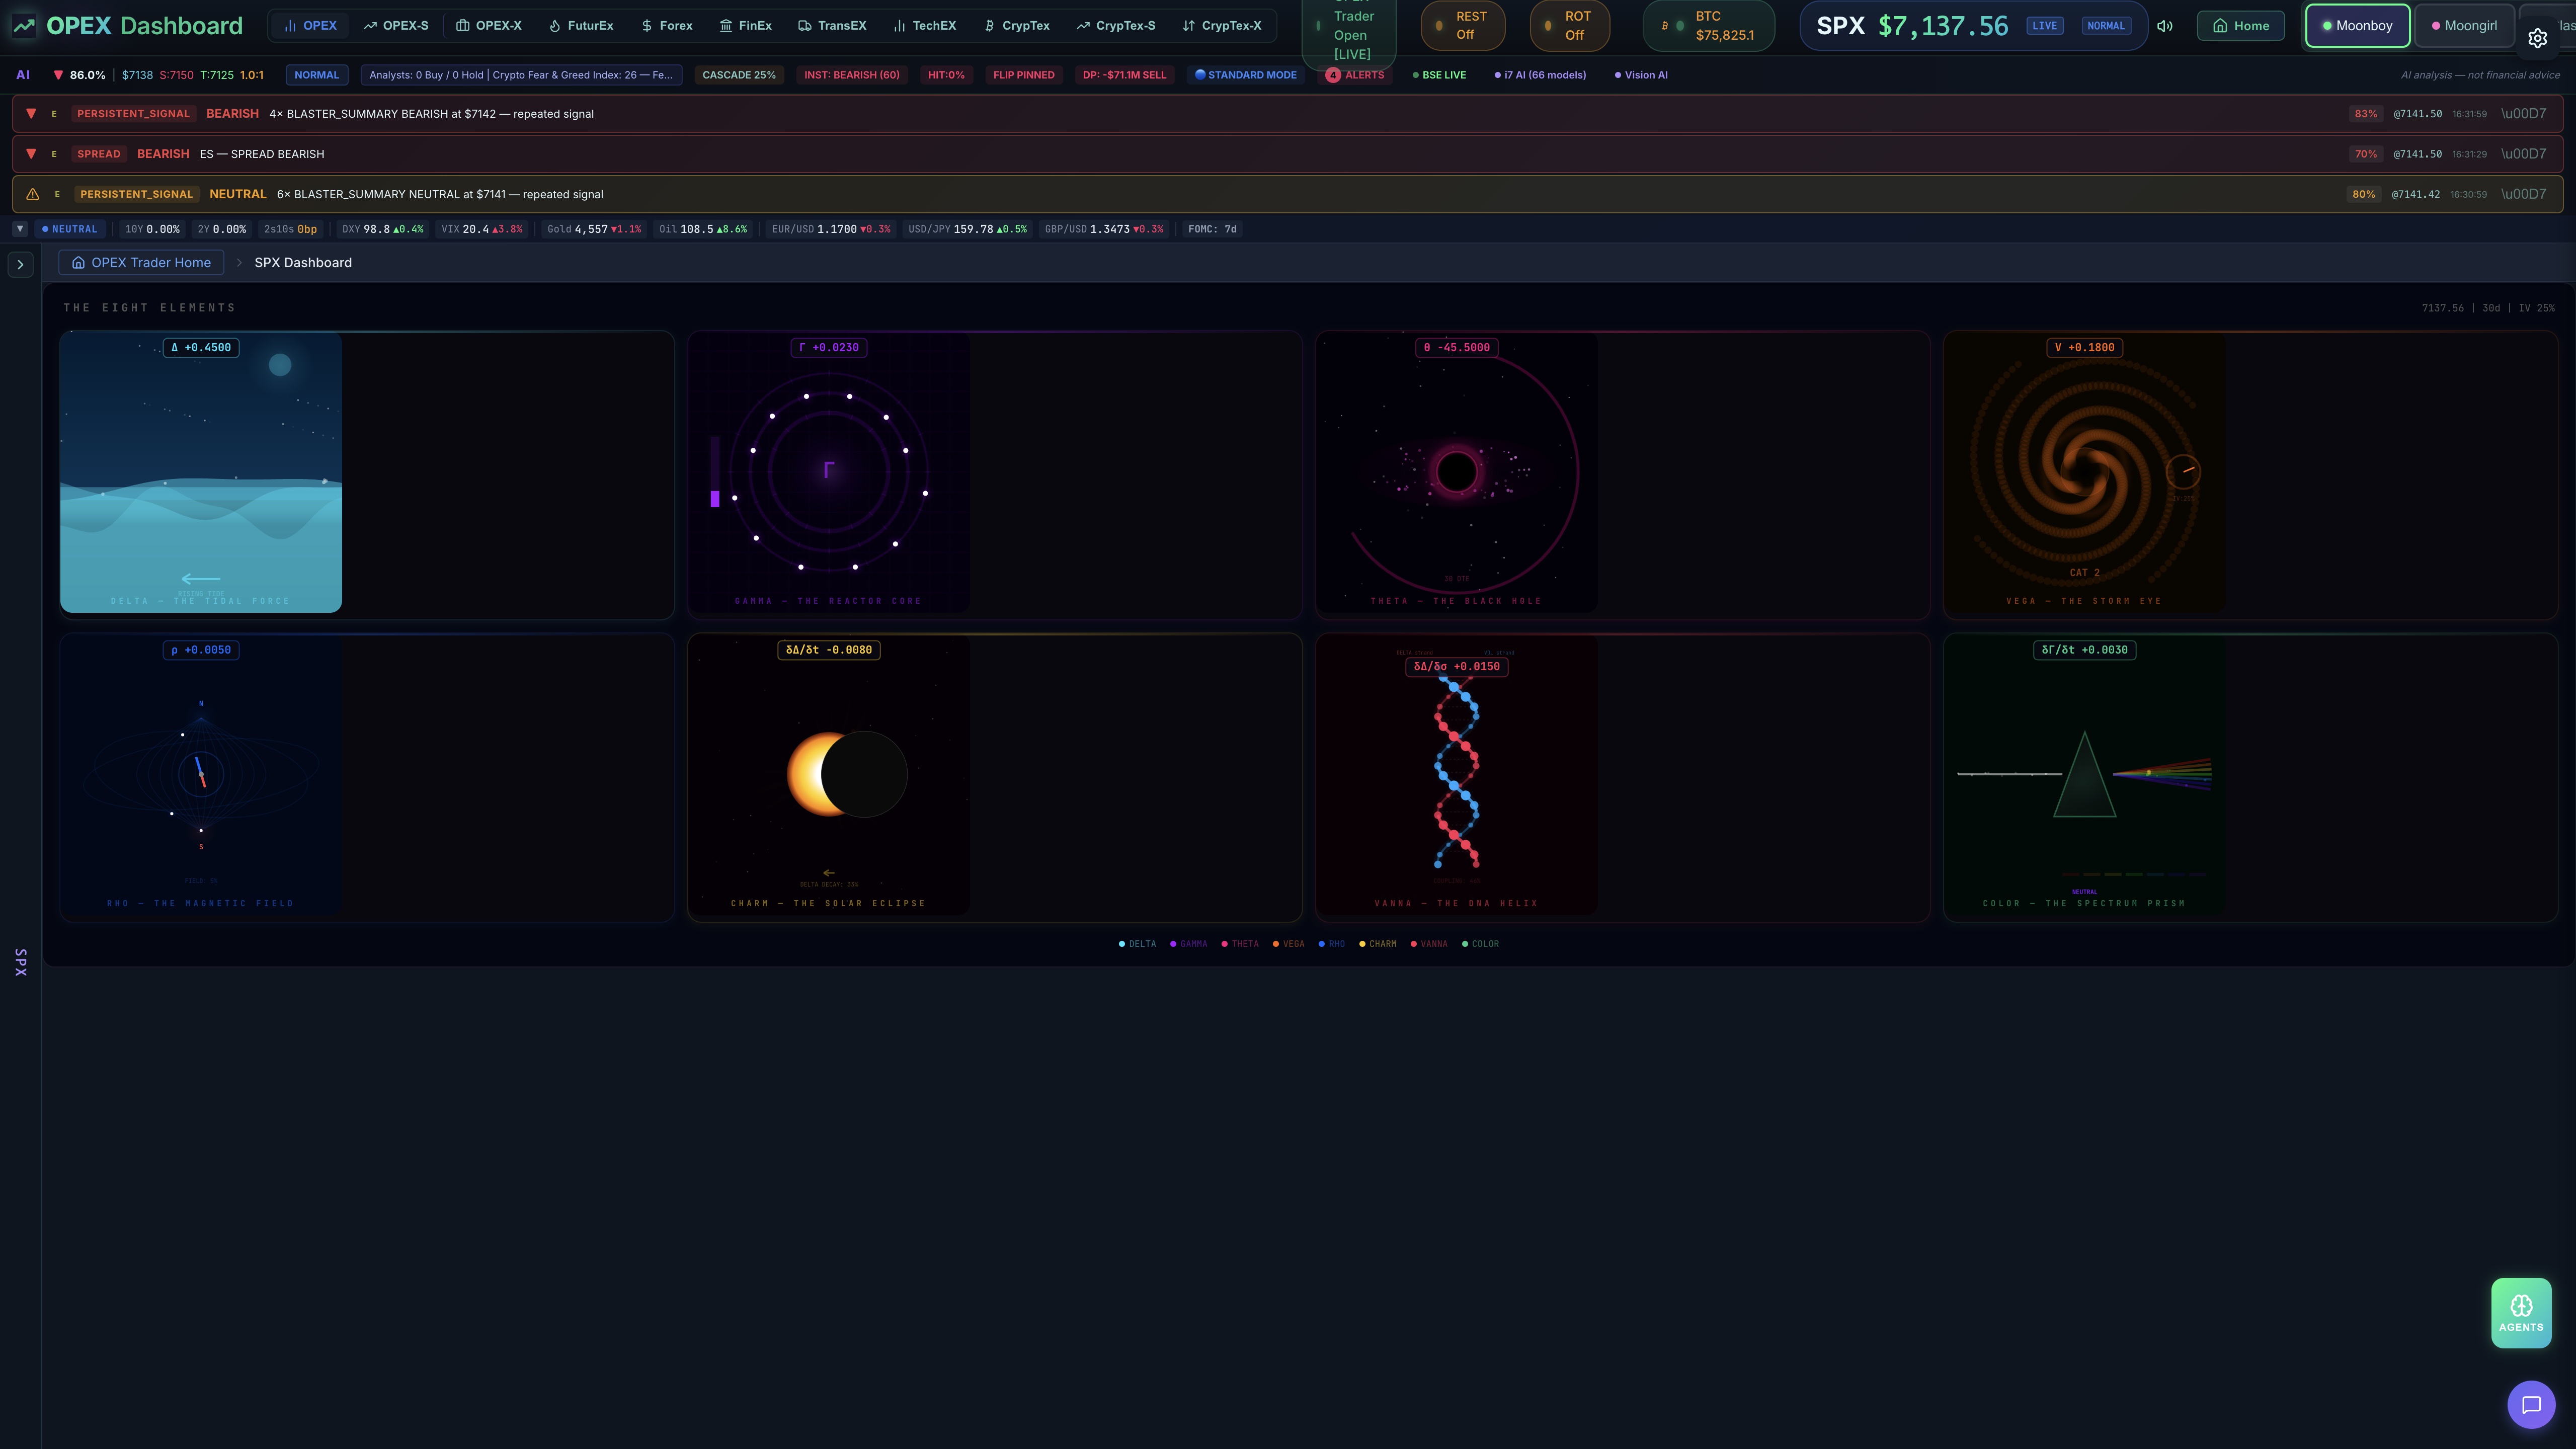
Greek Elements 3D — Interactive Visualizations
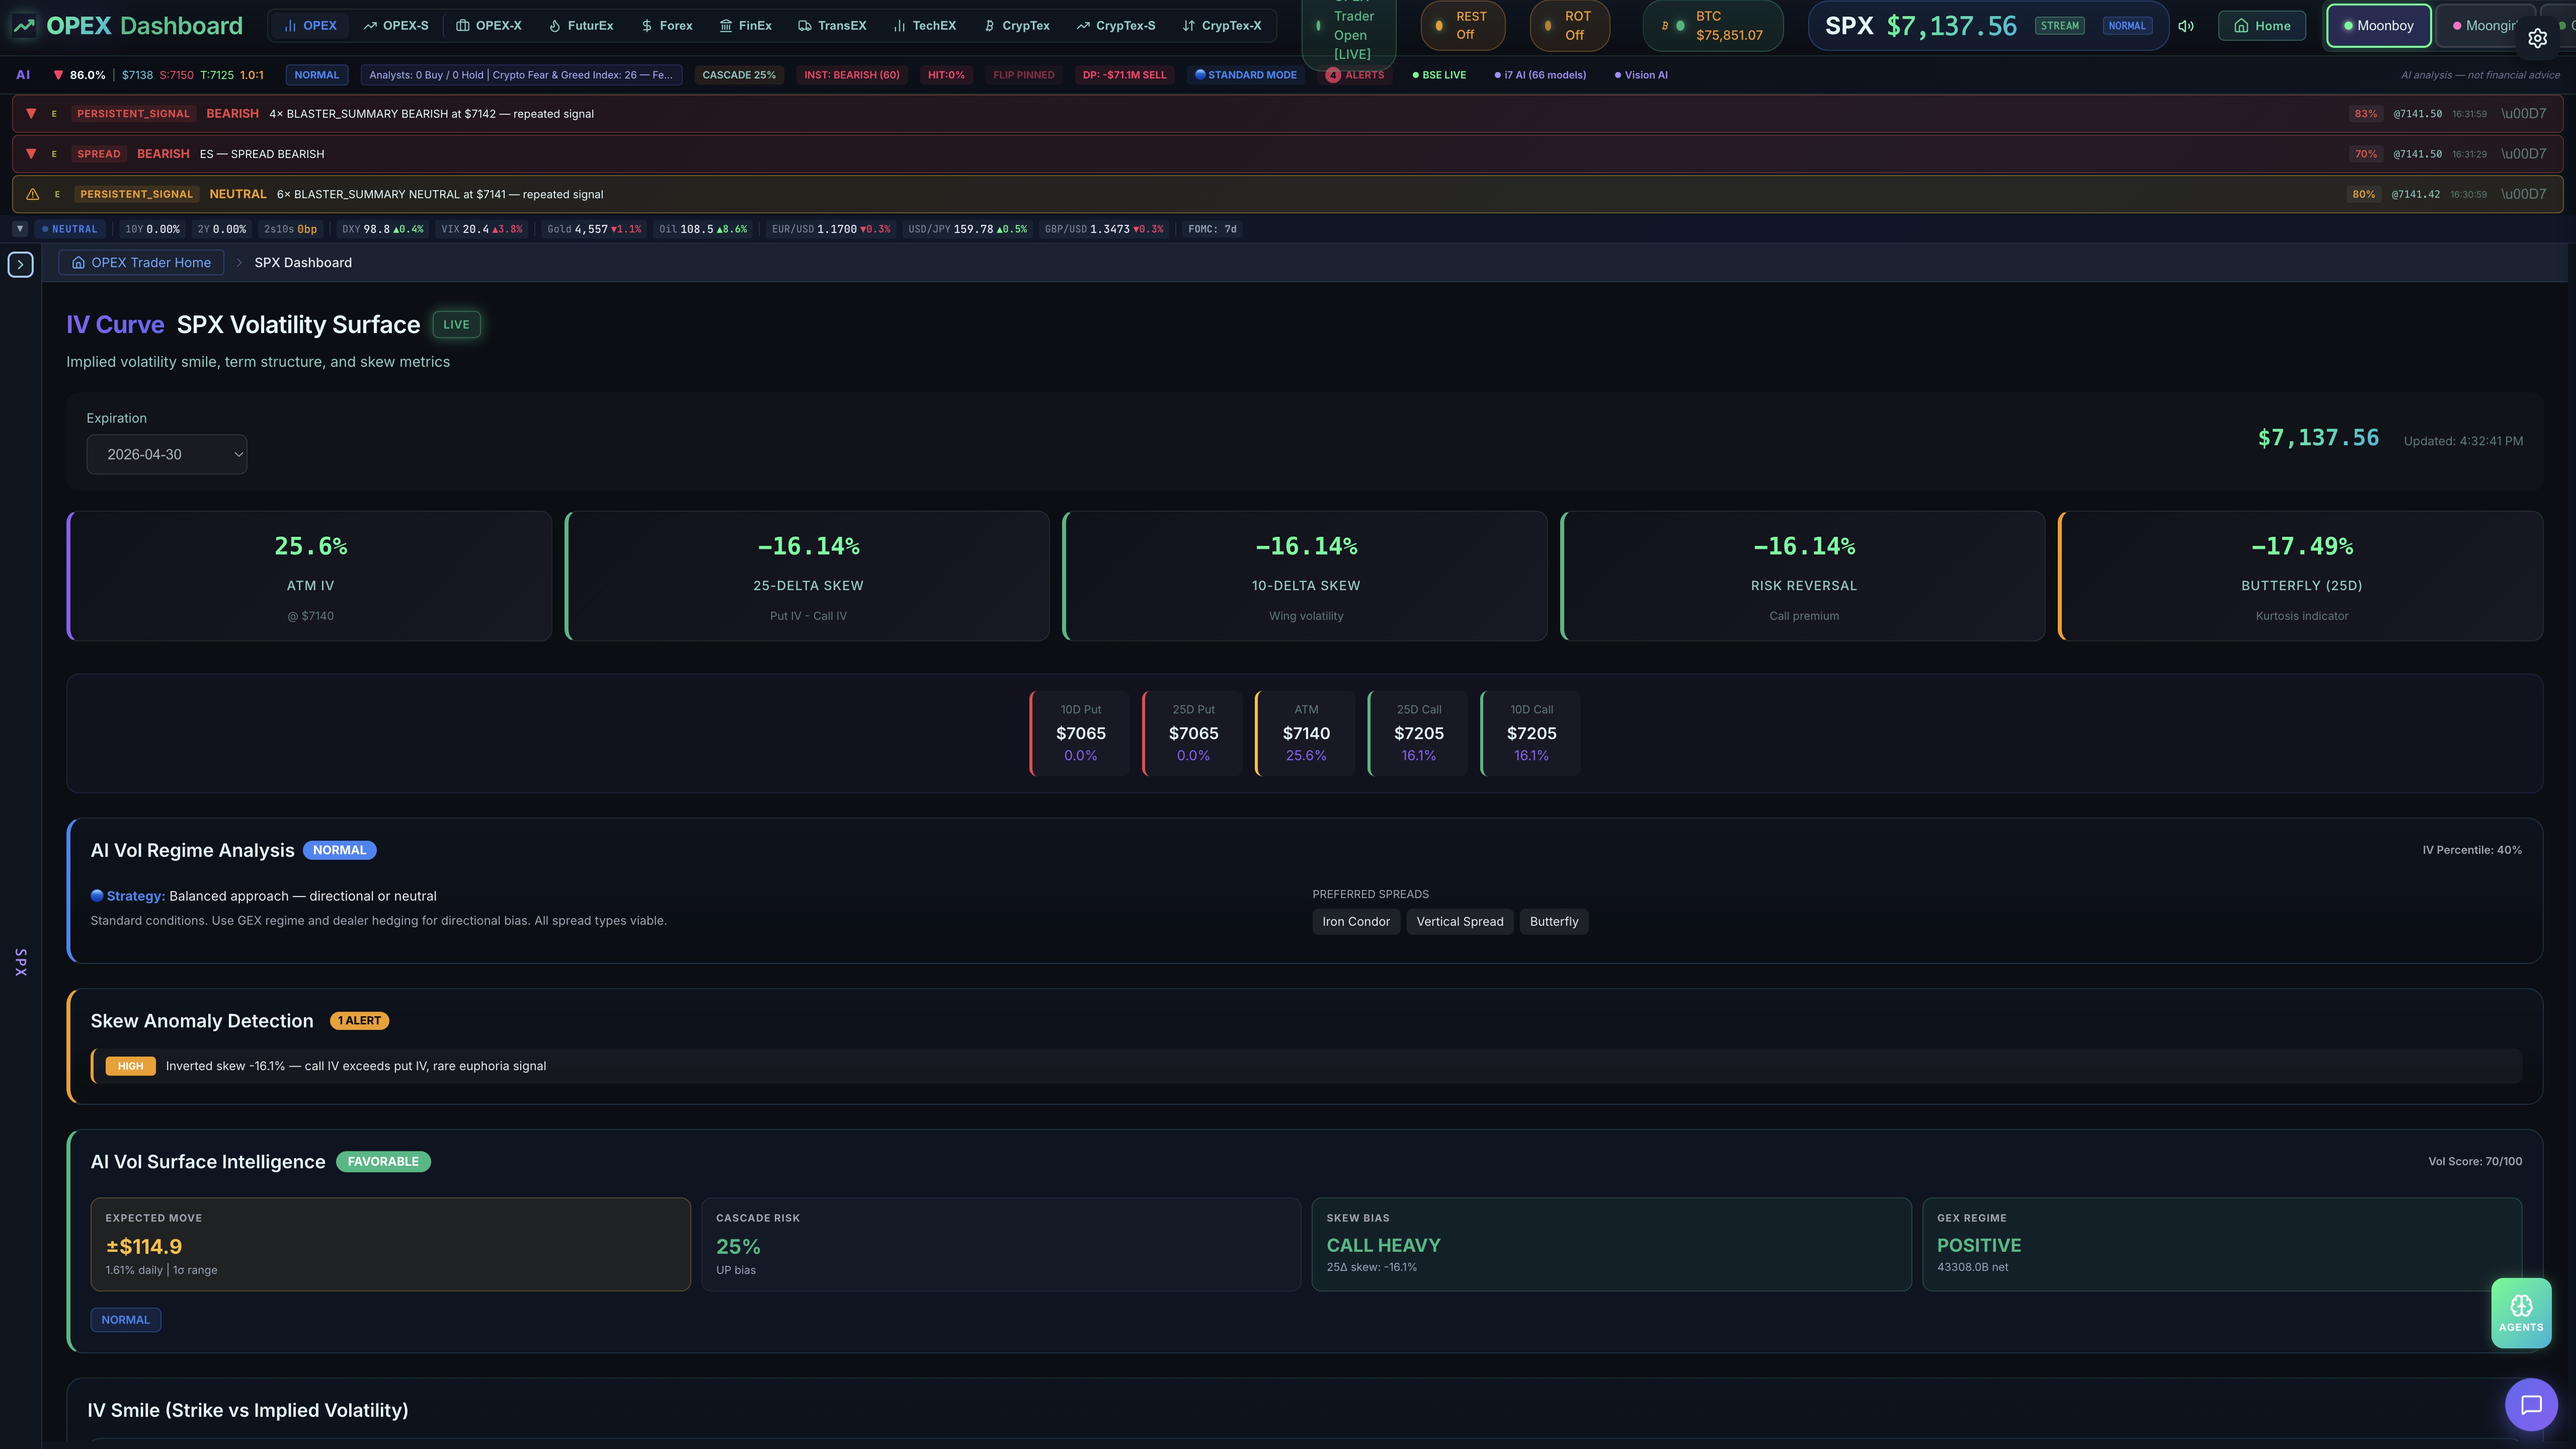
IV Curve — Volatility Surface Analysis
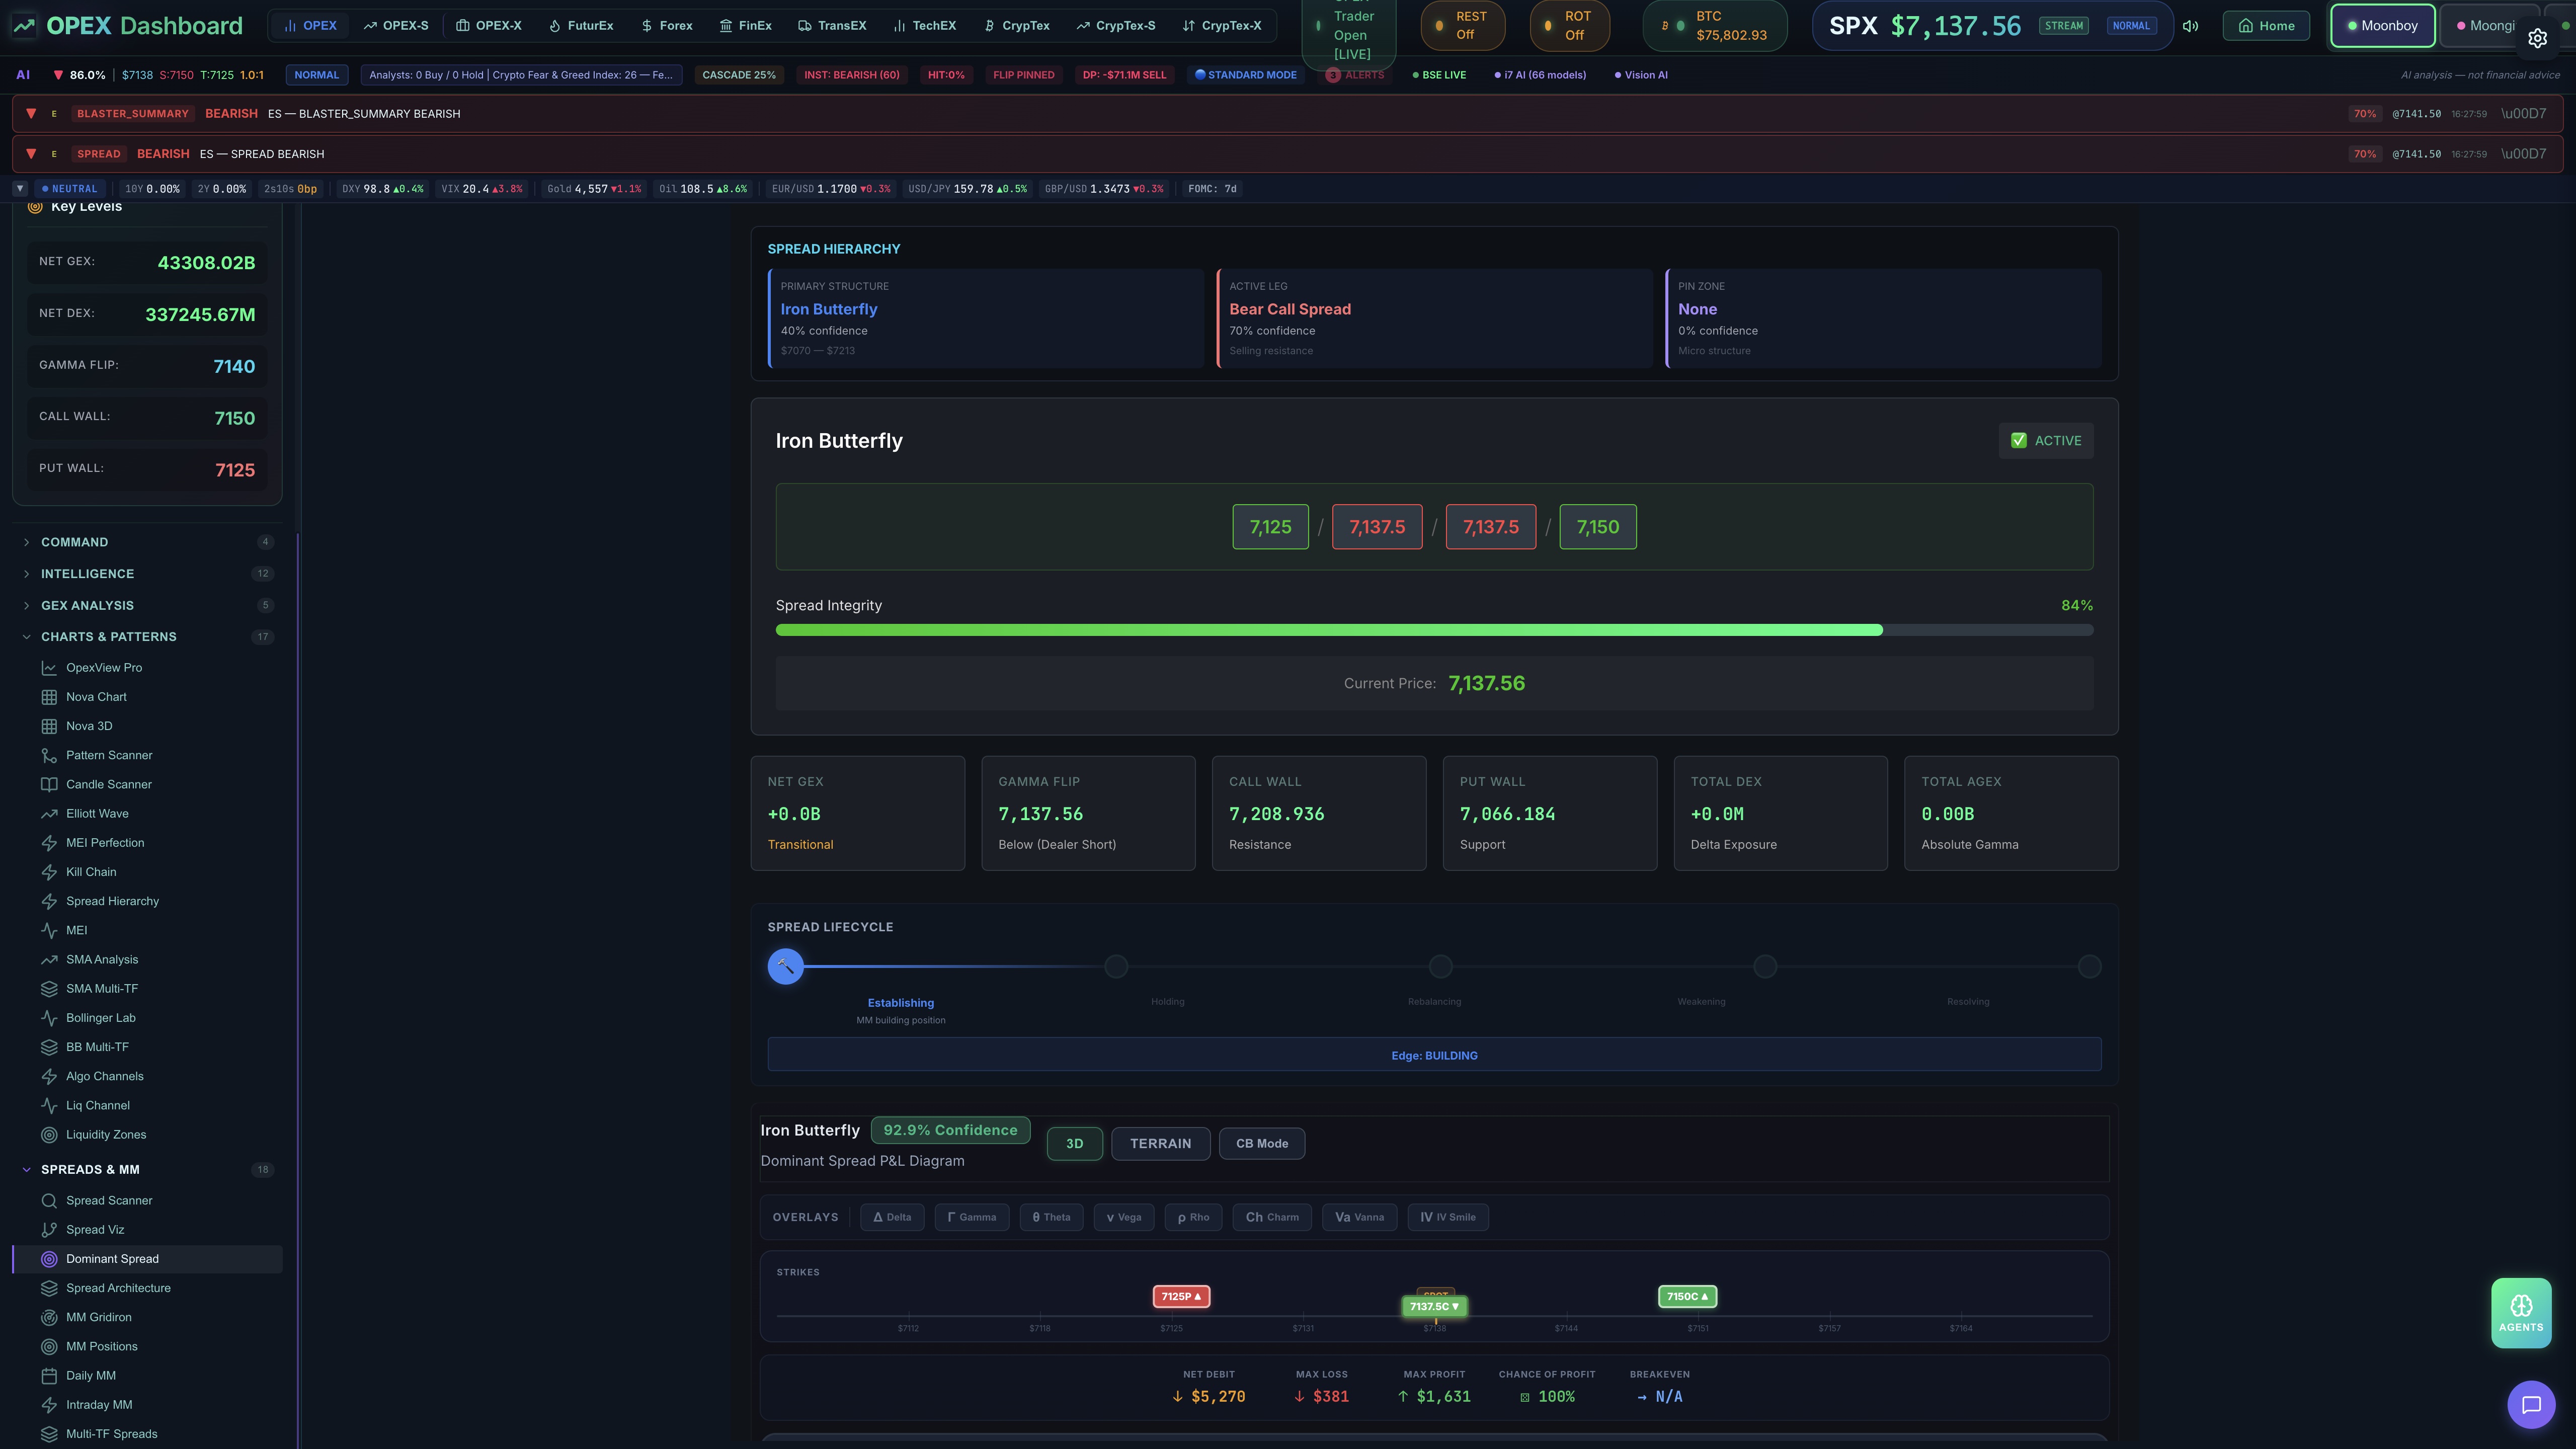
Spread Hierarchy — Iron Butterfly Lifecycle
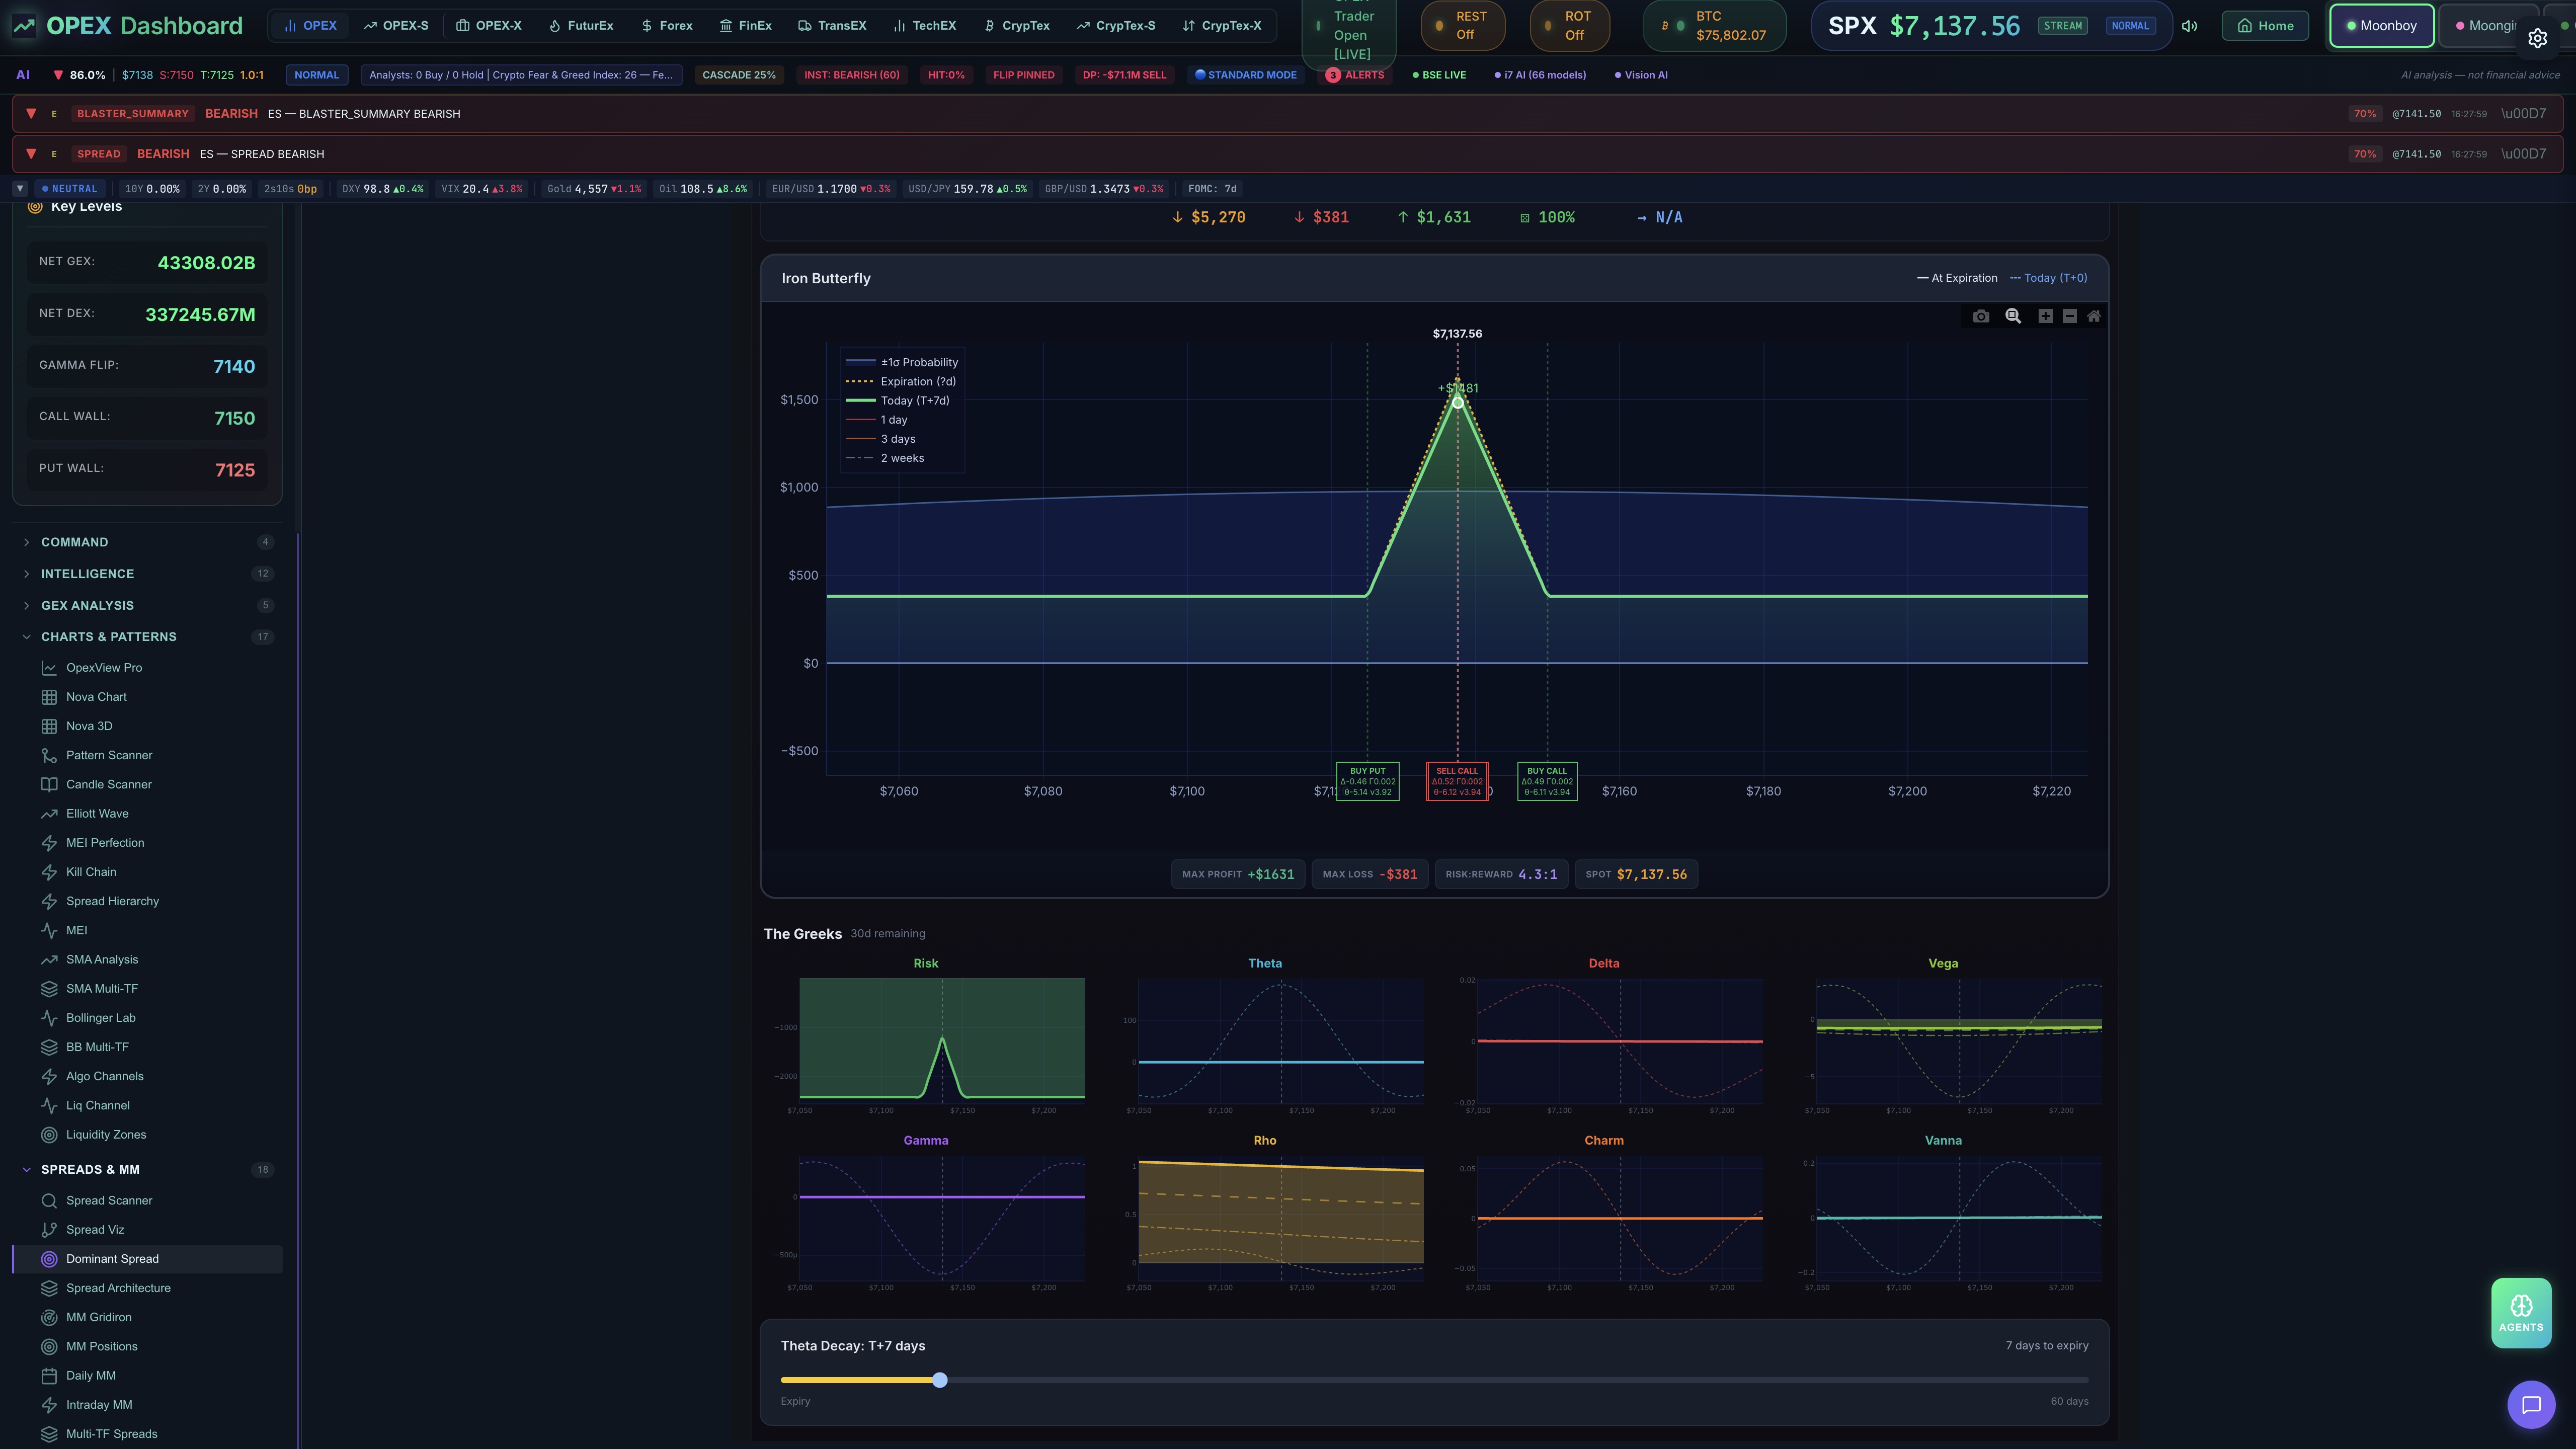
Spread P&L Diagram & Greeks
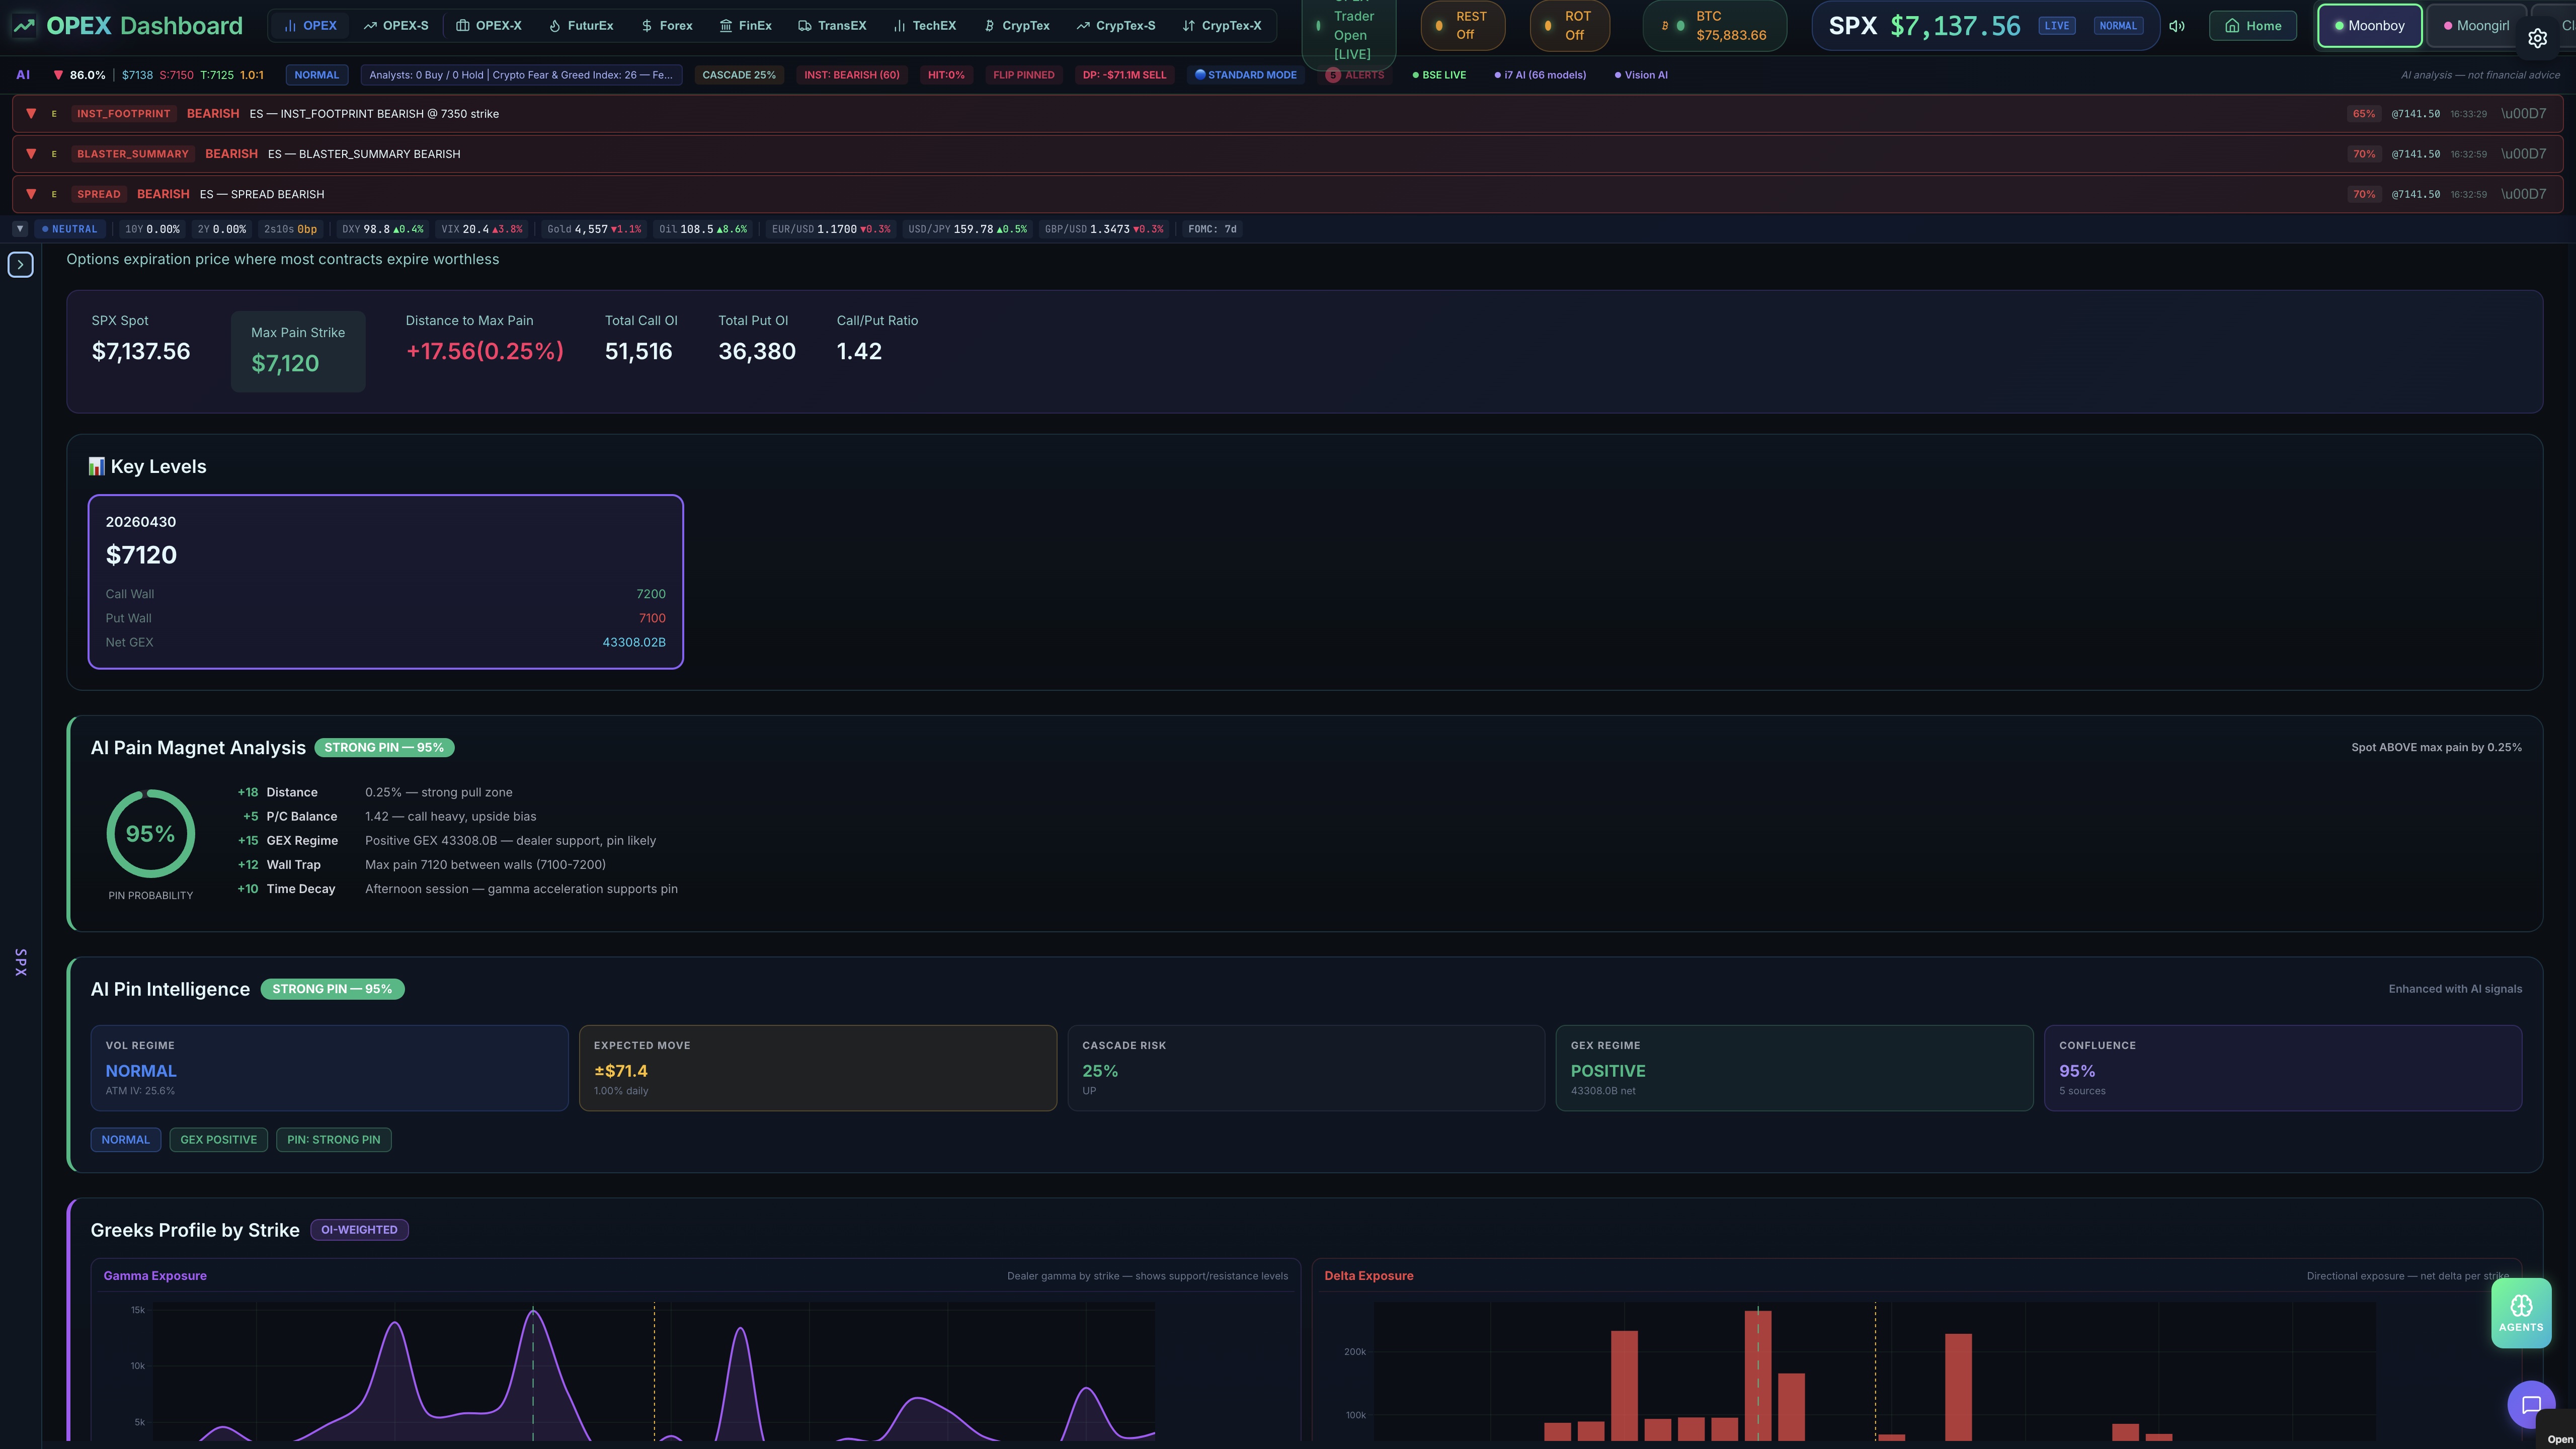
Max Pain & AI Pin Intelligence
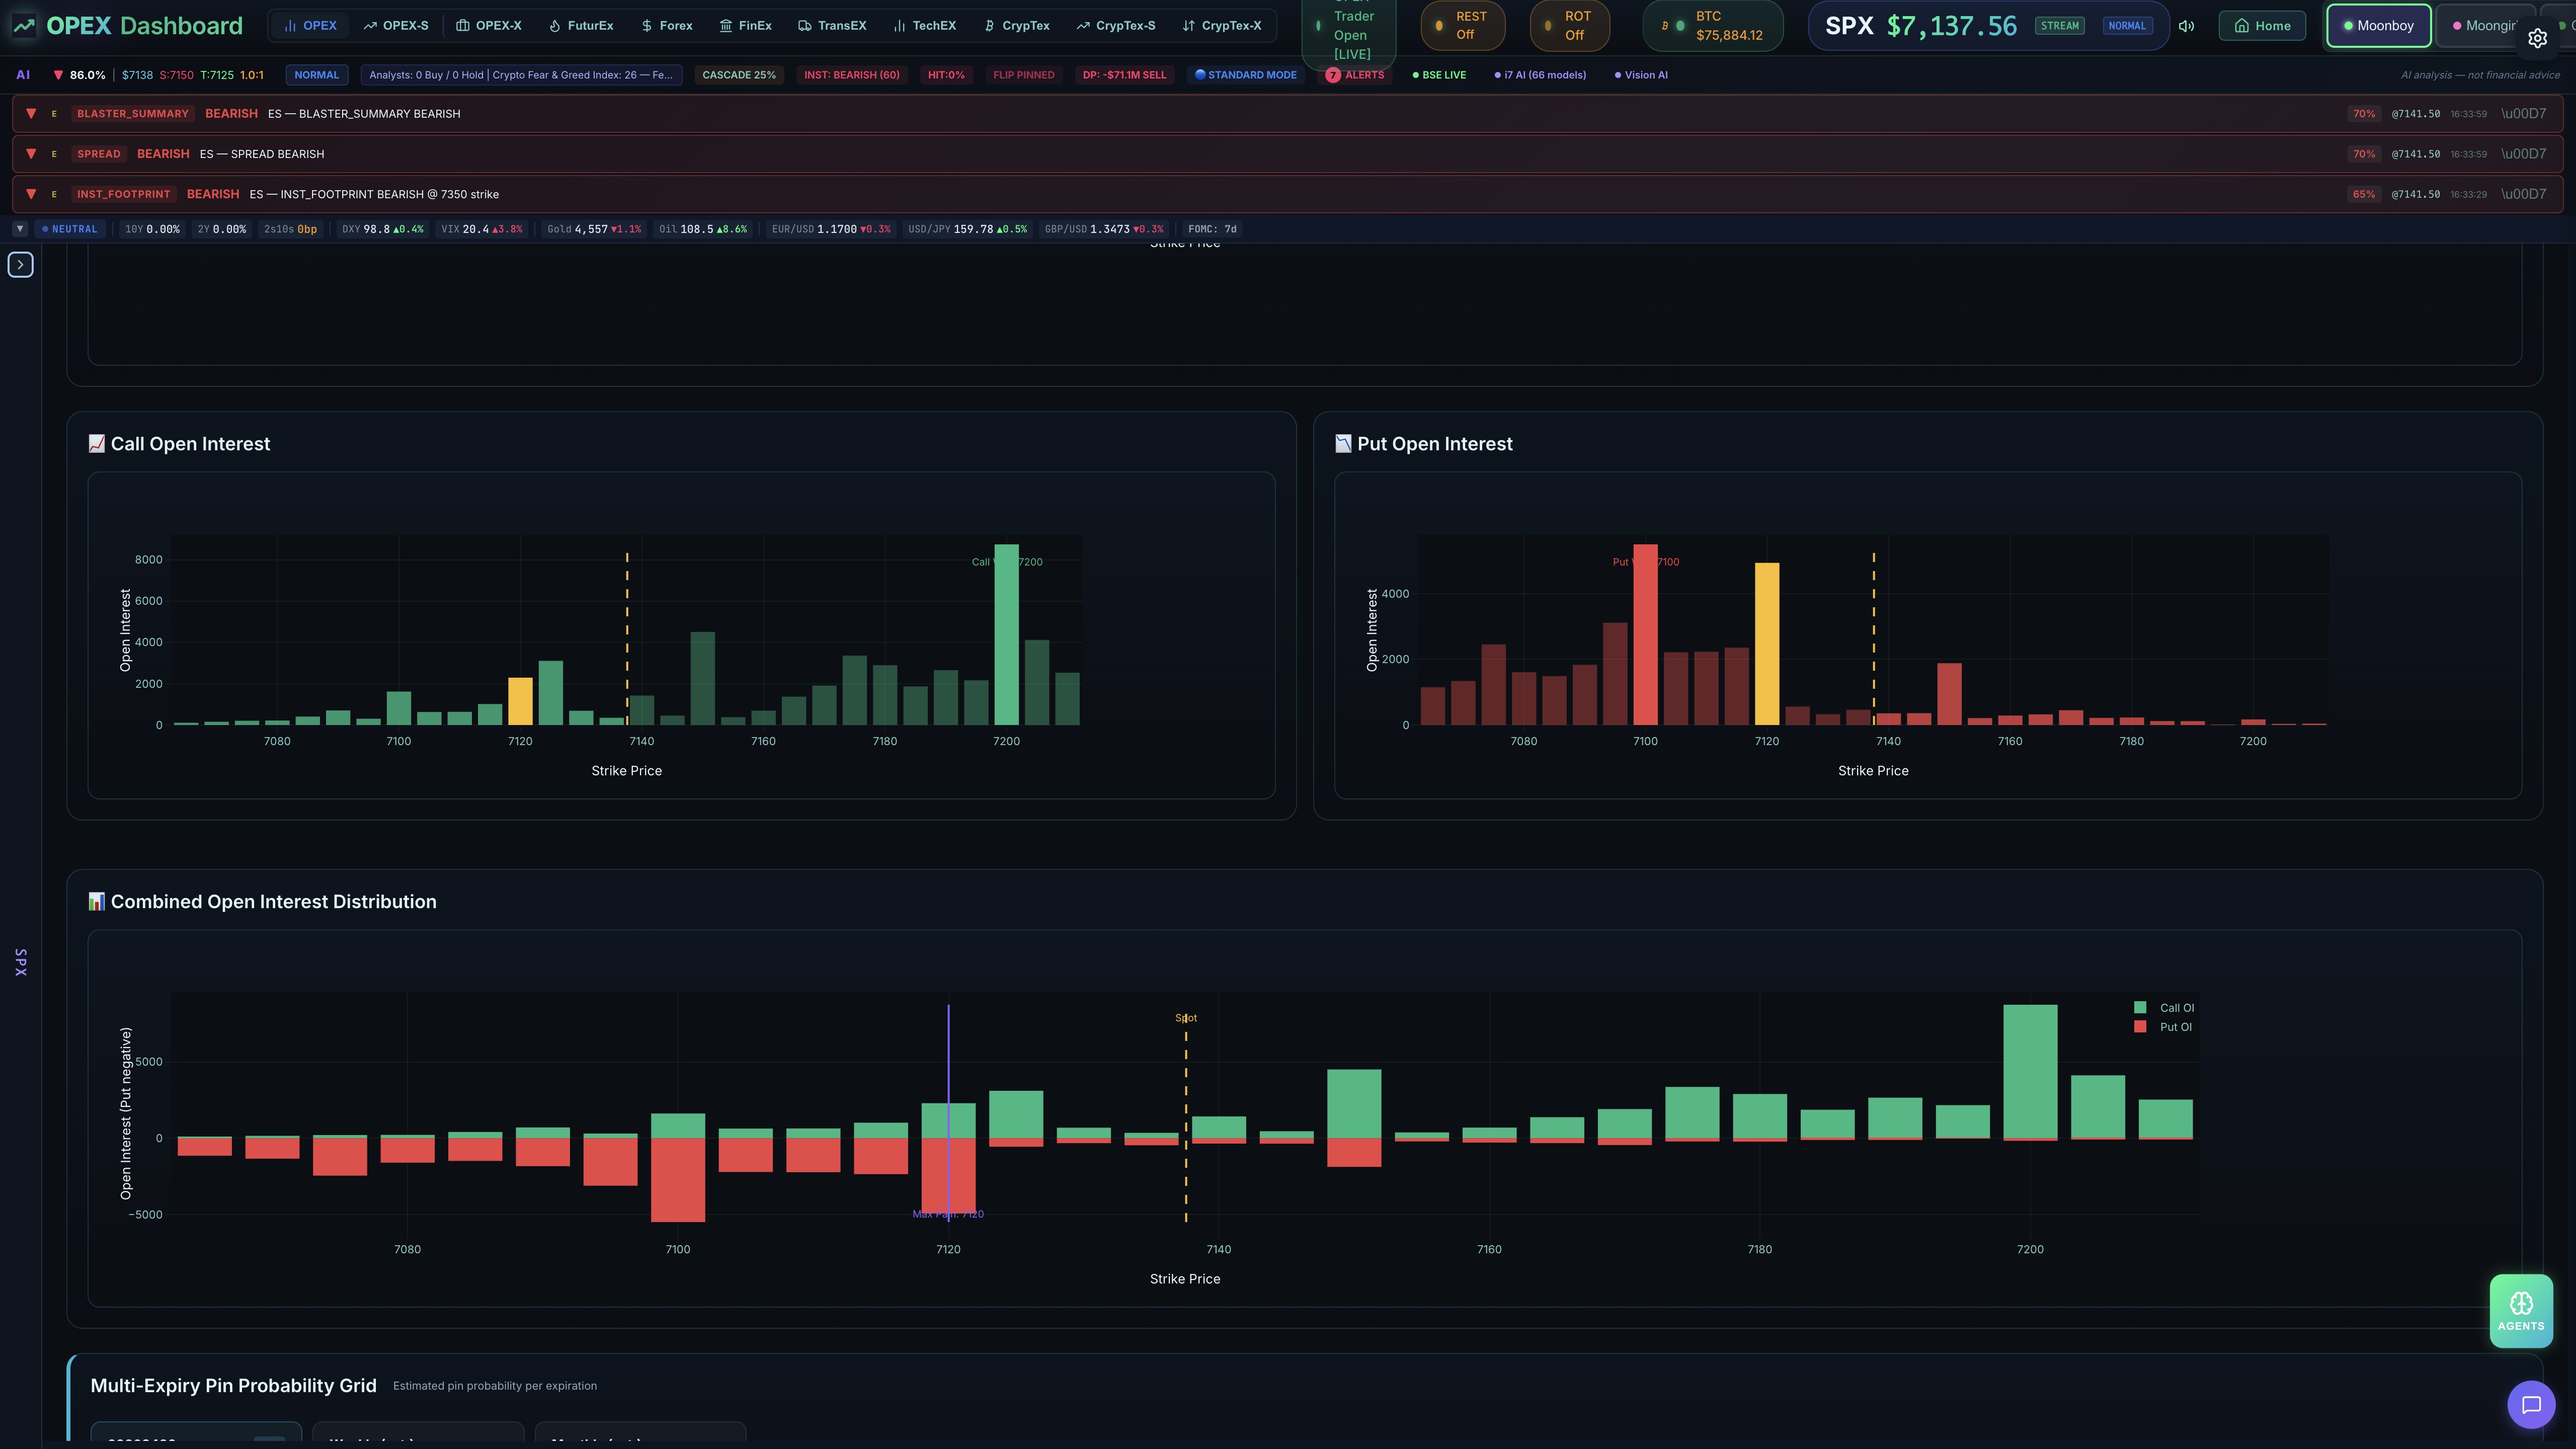
Open Interest Distribution & Pin Grid
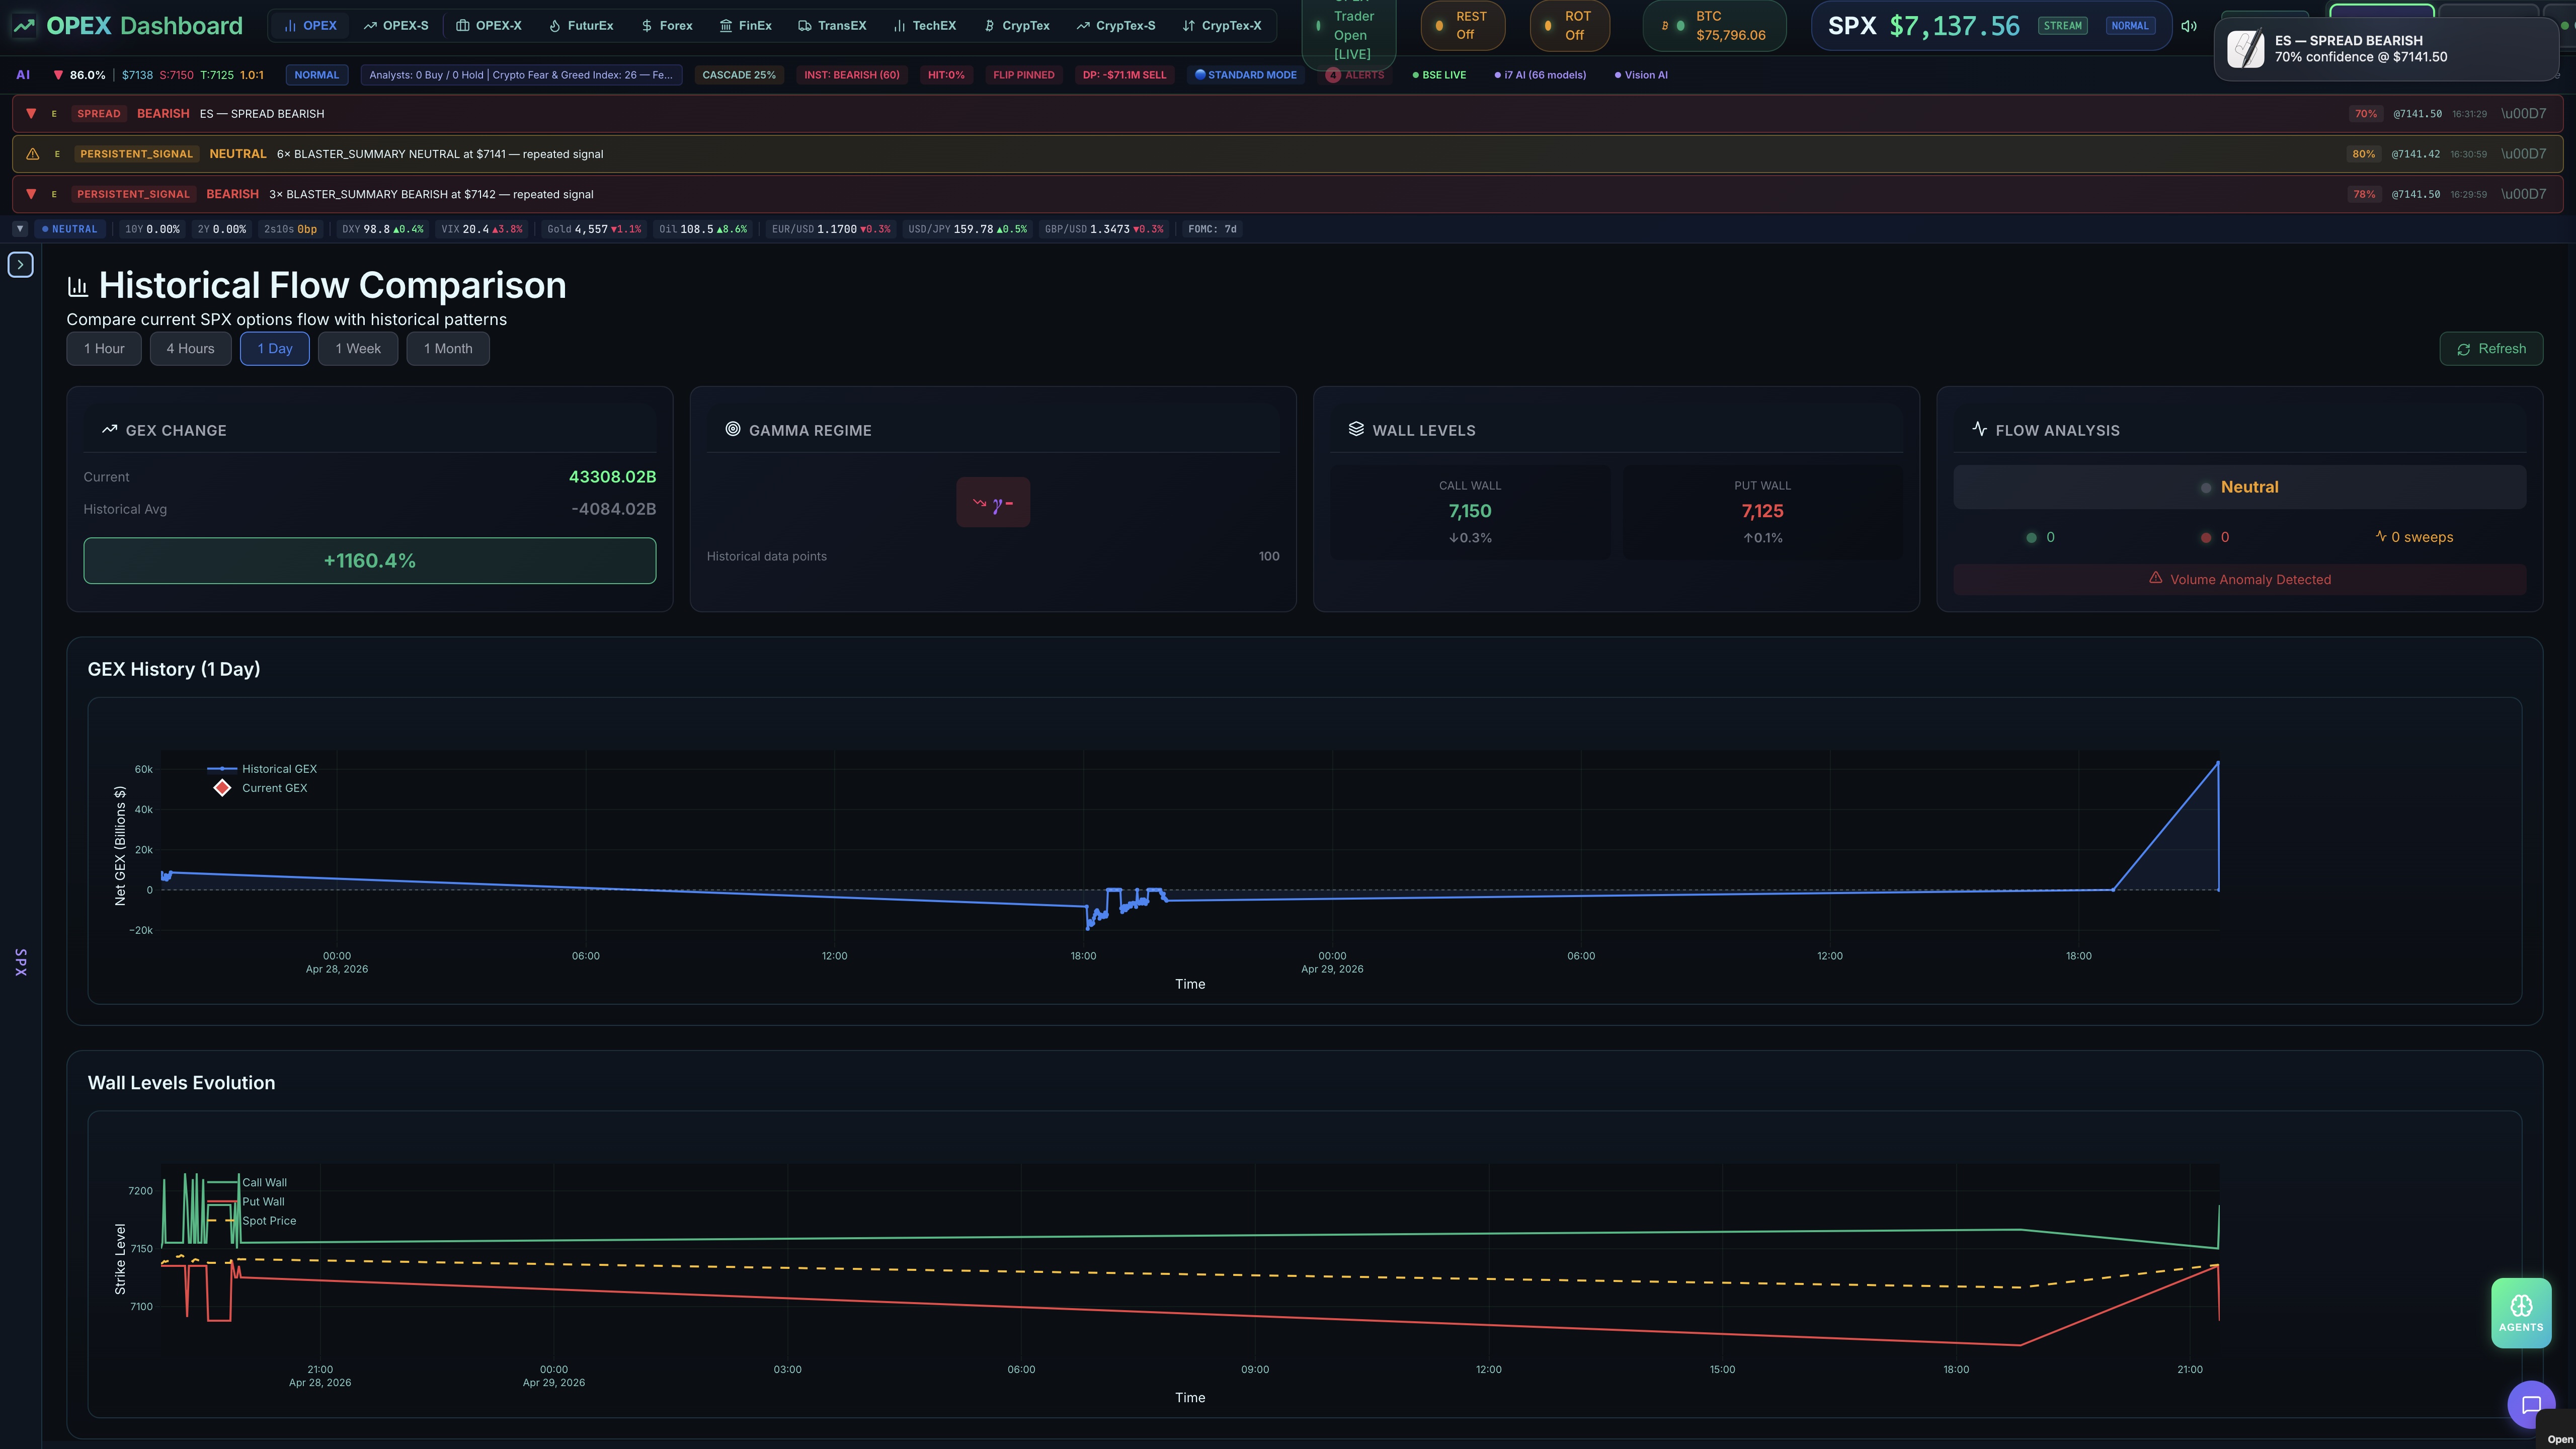
Historical Flow & GEX History
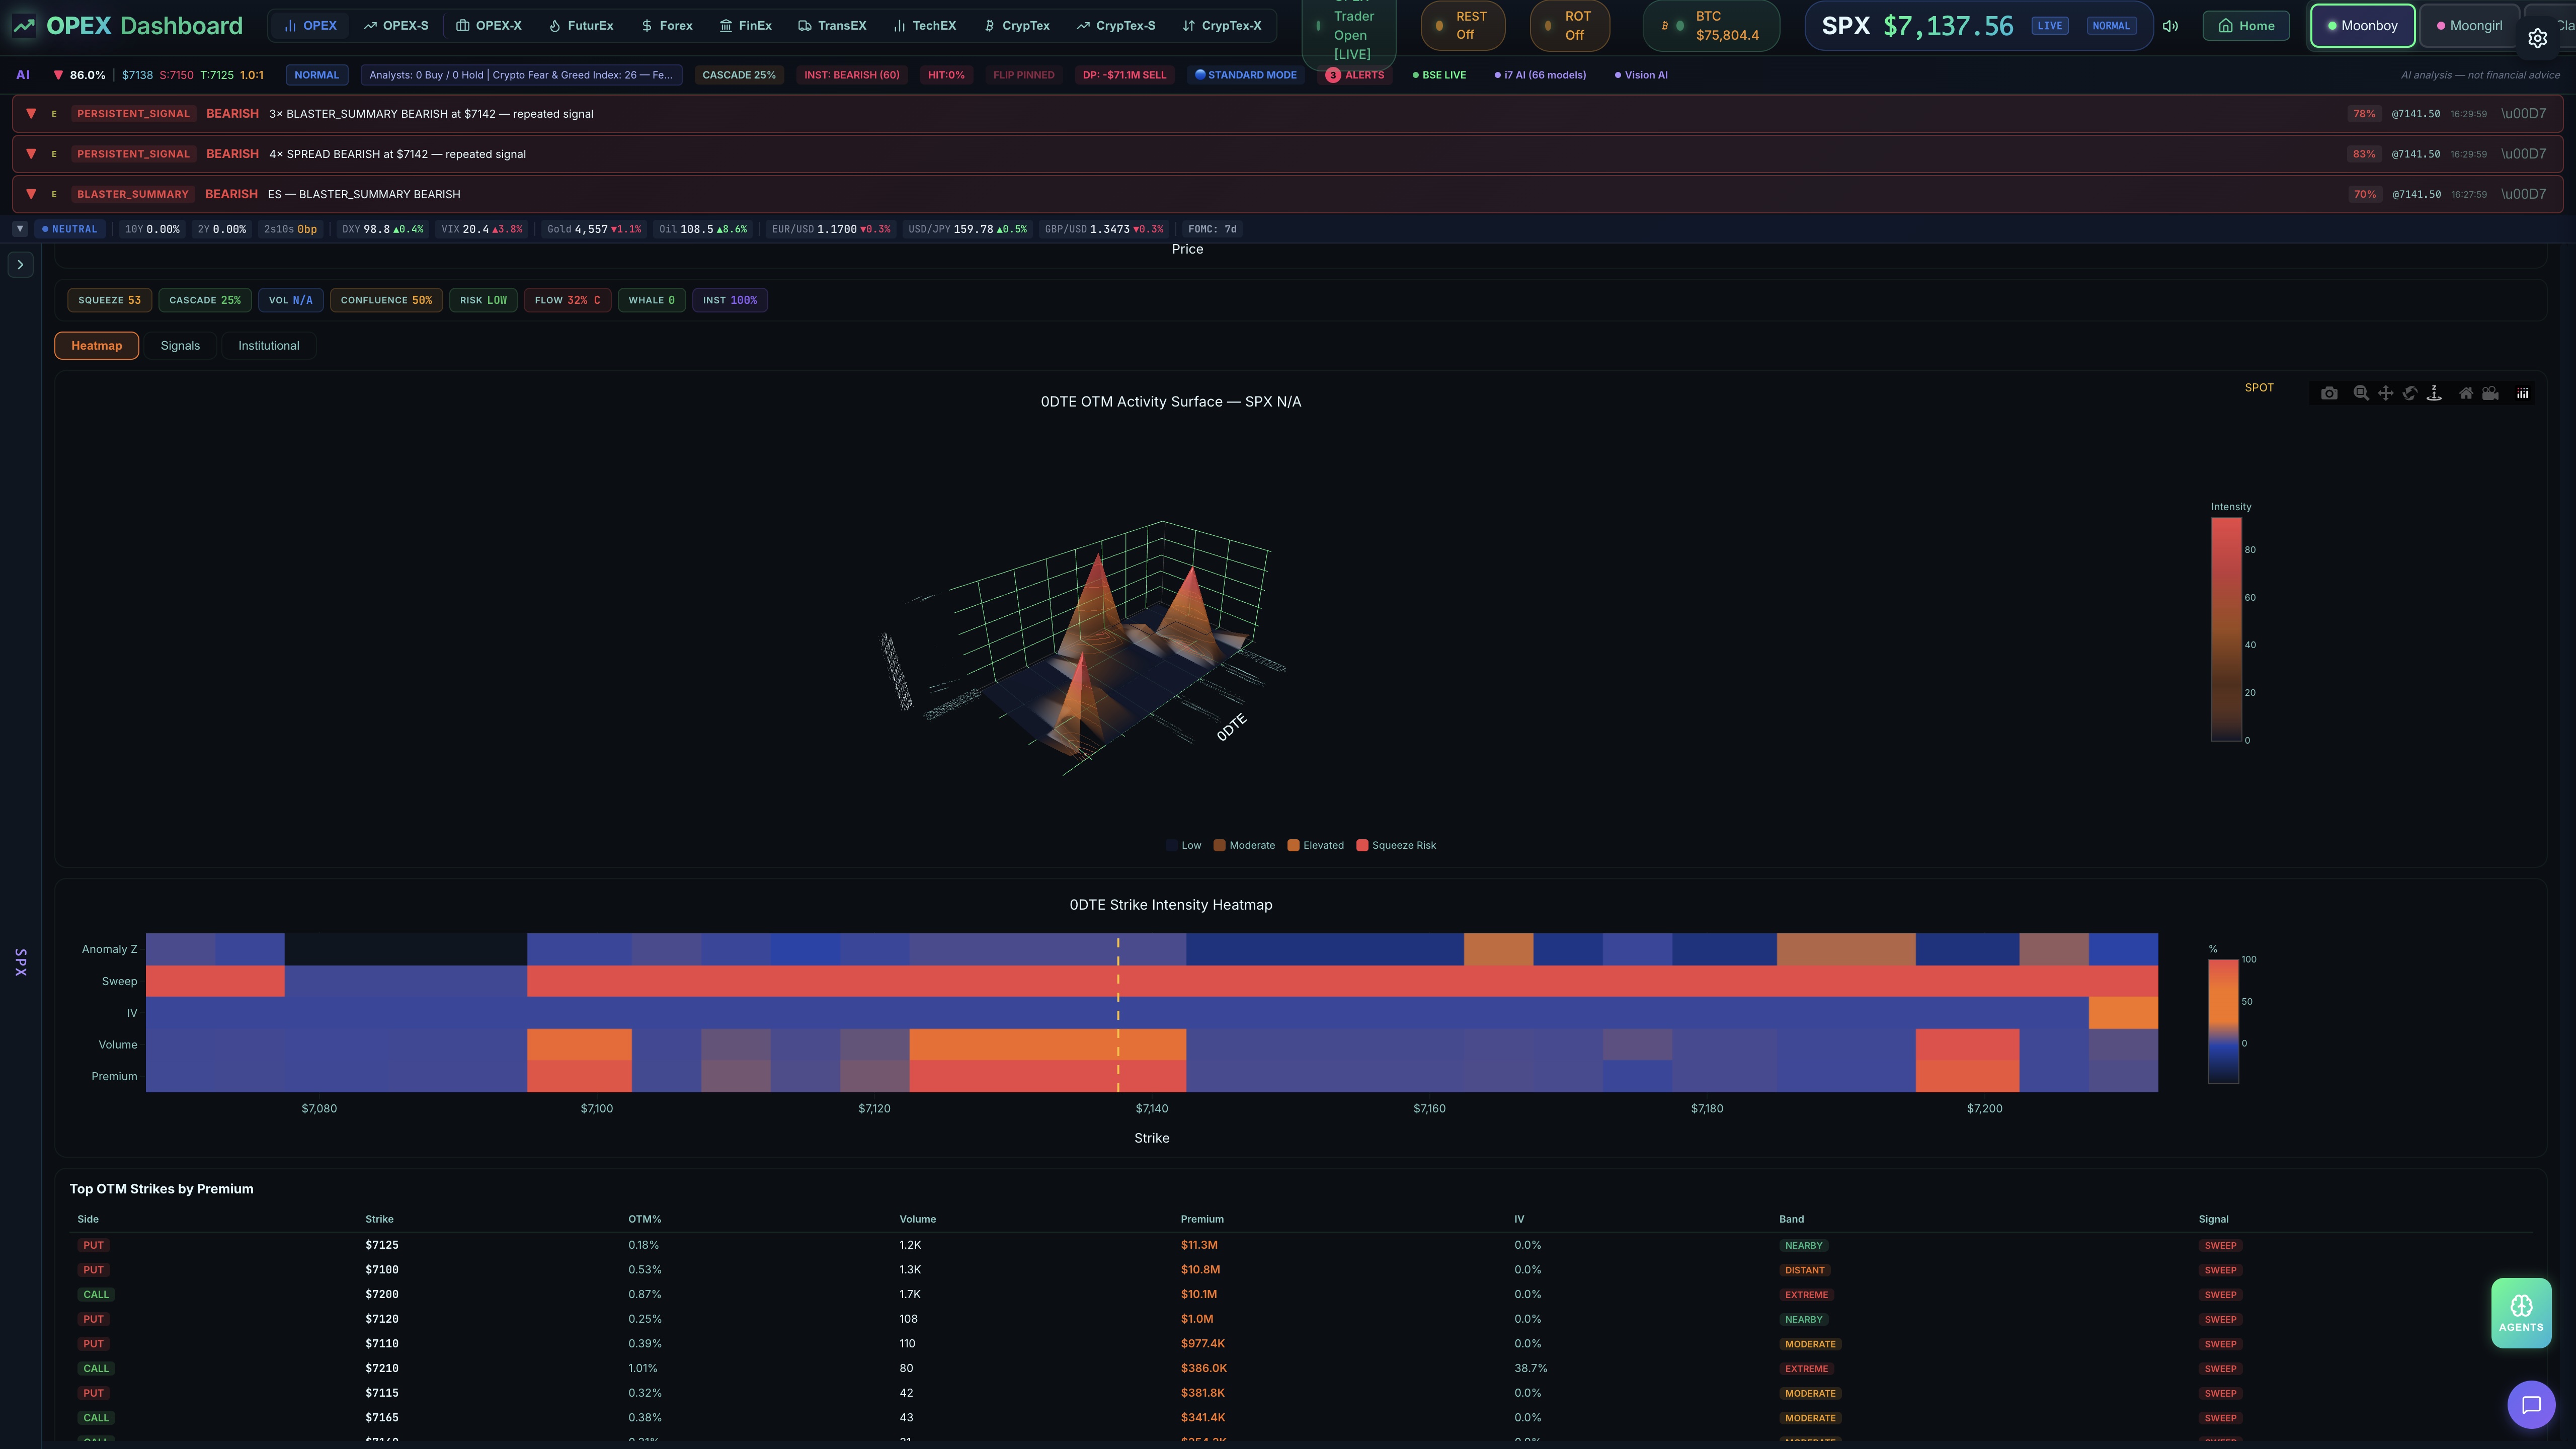
0DTE OTM Activity Surface & Strike Heatmap
Pro Chart — Full Overlay Suite
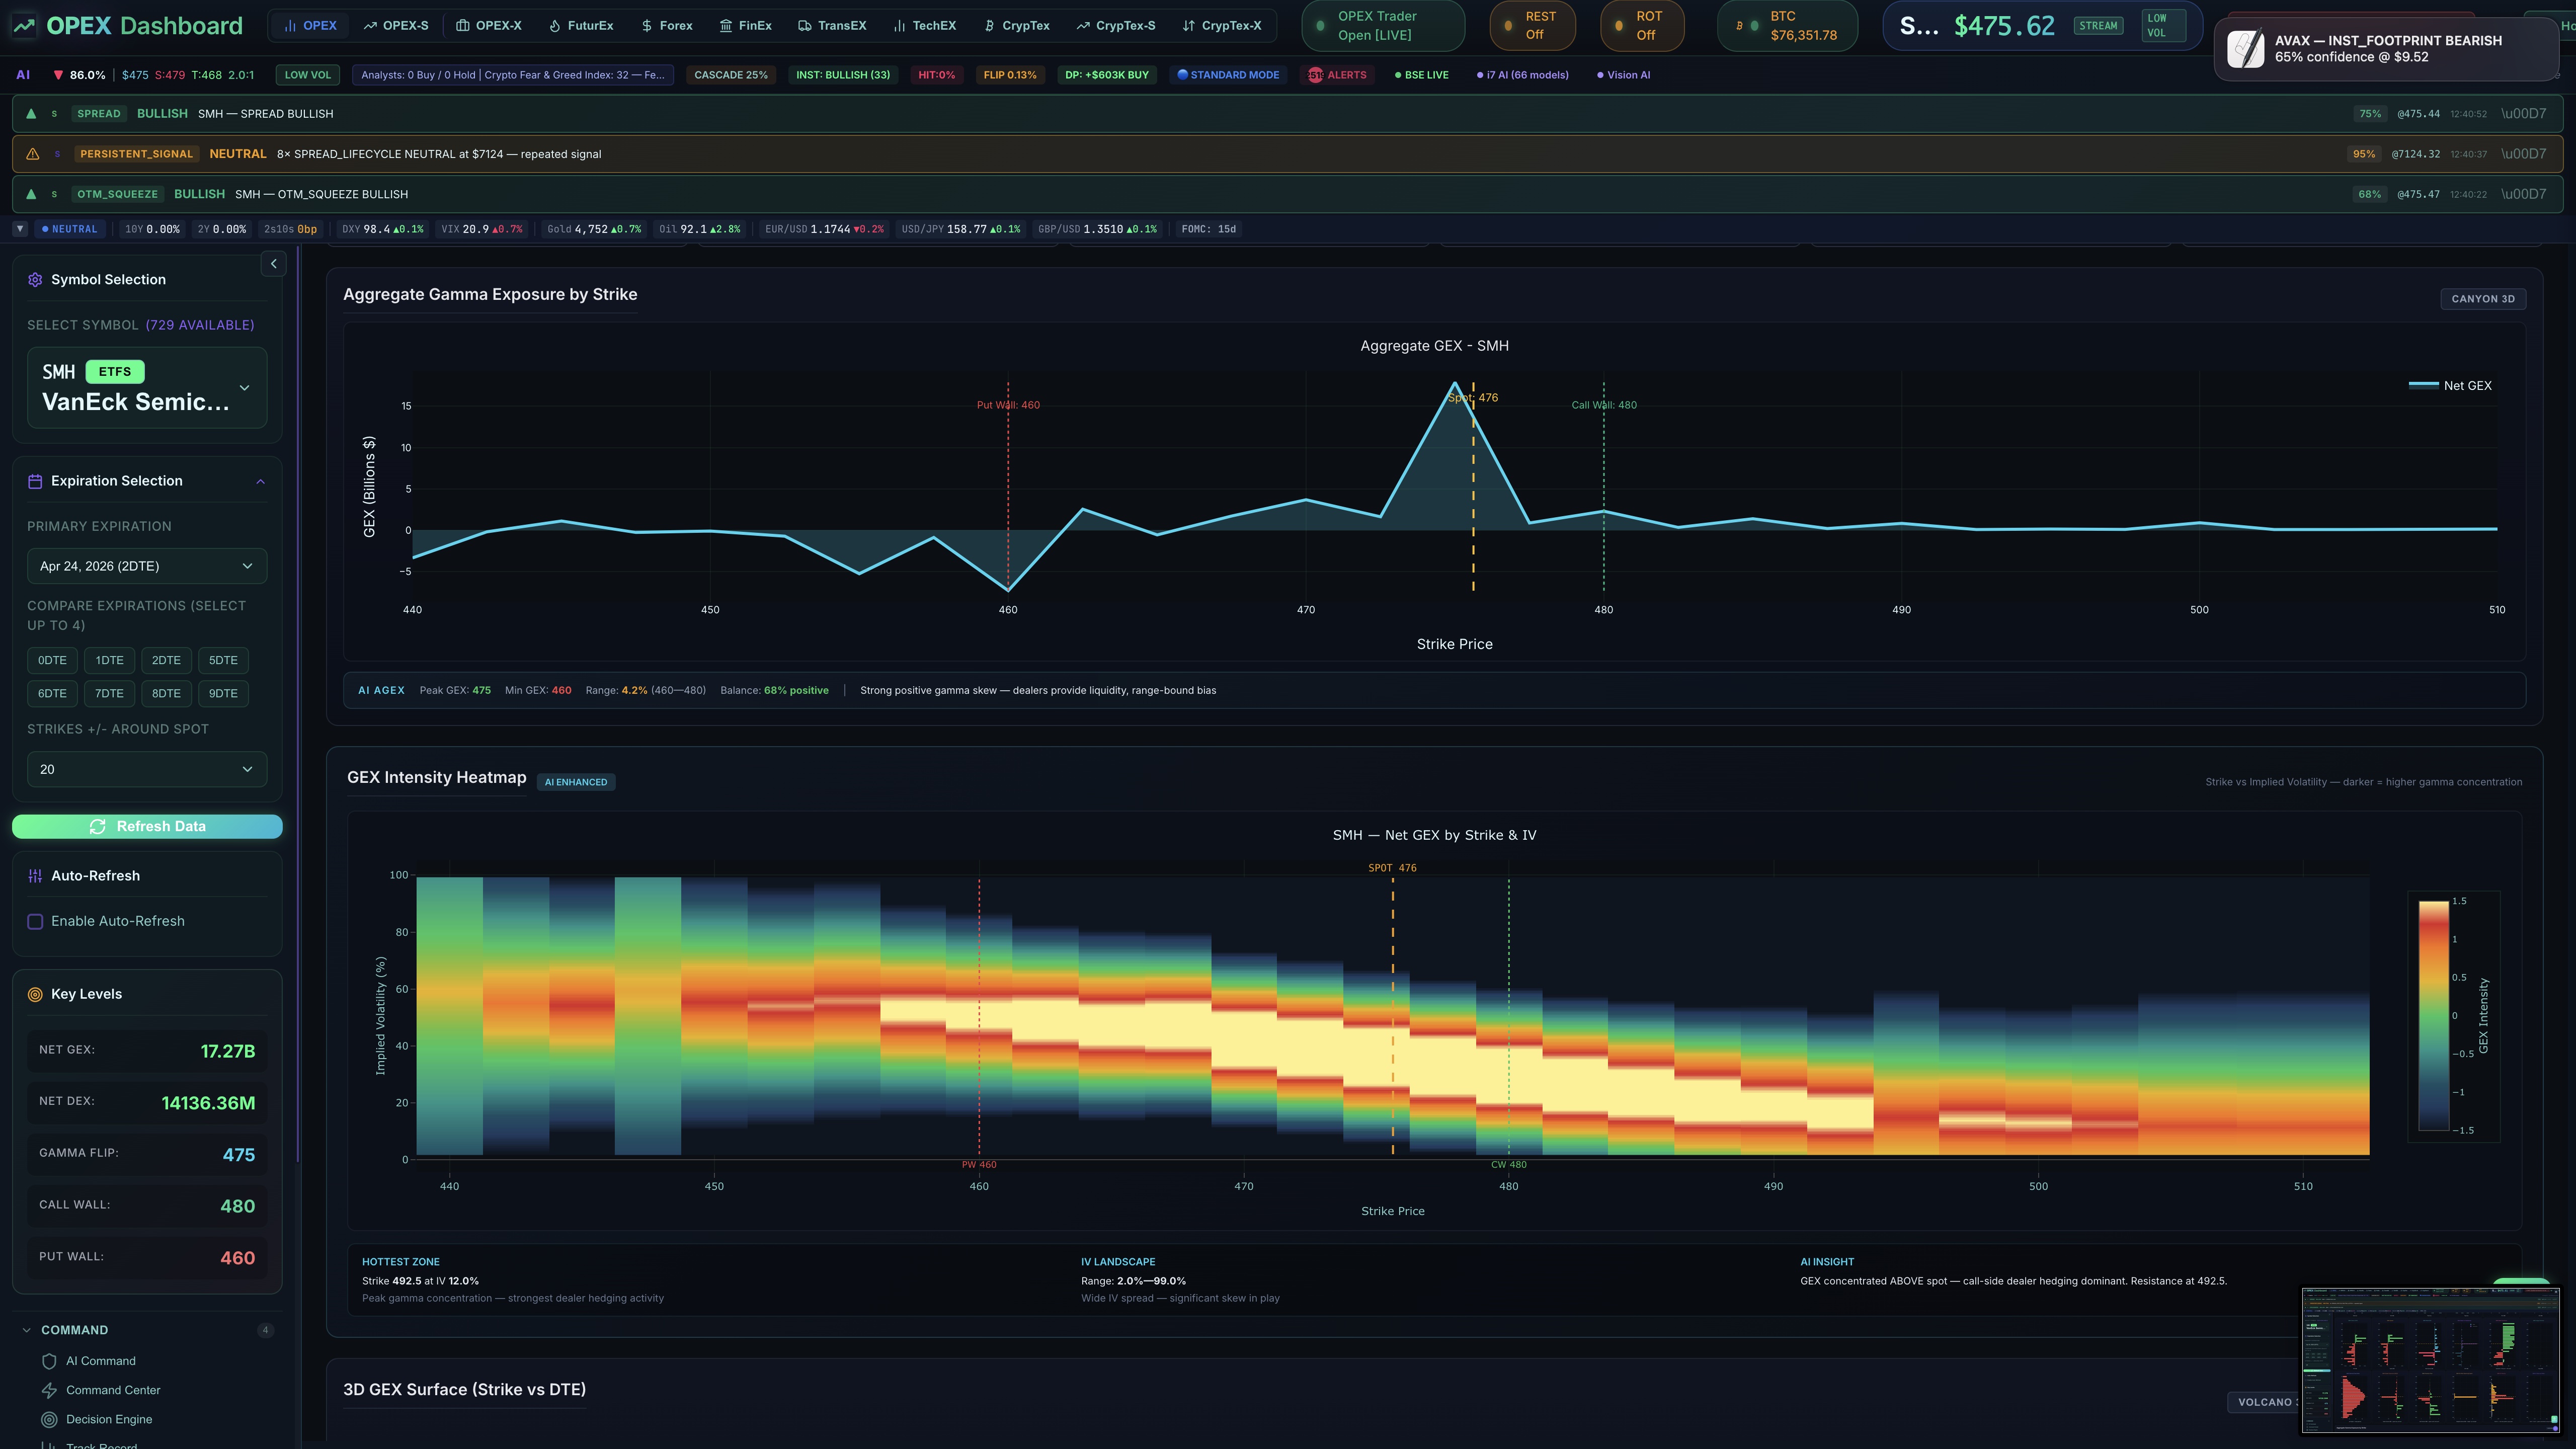
GEX/DEX Intensity Heatmap
Forex Suite
7-Tab Currency Intelligence
Professional forex analytics integrated directly into OPEX. Monitor 13 currency pairs with session-aware analysis, carry trade scoring, and a unique Forex→Options Nexus that bridges currency moves to equity options flow.
Forex Command Center
6-panel nerve center: live rates for 13 pairs, currency strength radar, session heat map, carry trade rankings, and the Forex→Options Nexus bridge.
Forex Pro Chart
13 major and cross pairs across 6 timeframes with session boxes, pivot points, ADR/AWR bands, and GEX overlay integration.
Currency Strength Index
8×8 currency strength heatmap with real-time divergence alerts, cross-pair rotation signals, and relative momentum scoring.
Carry Trade Monitor
5-factor conviction engine scoring carry opportunities with risk-adjusted rankings, carry vs. momentum scatter, and yield differential tracking.
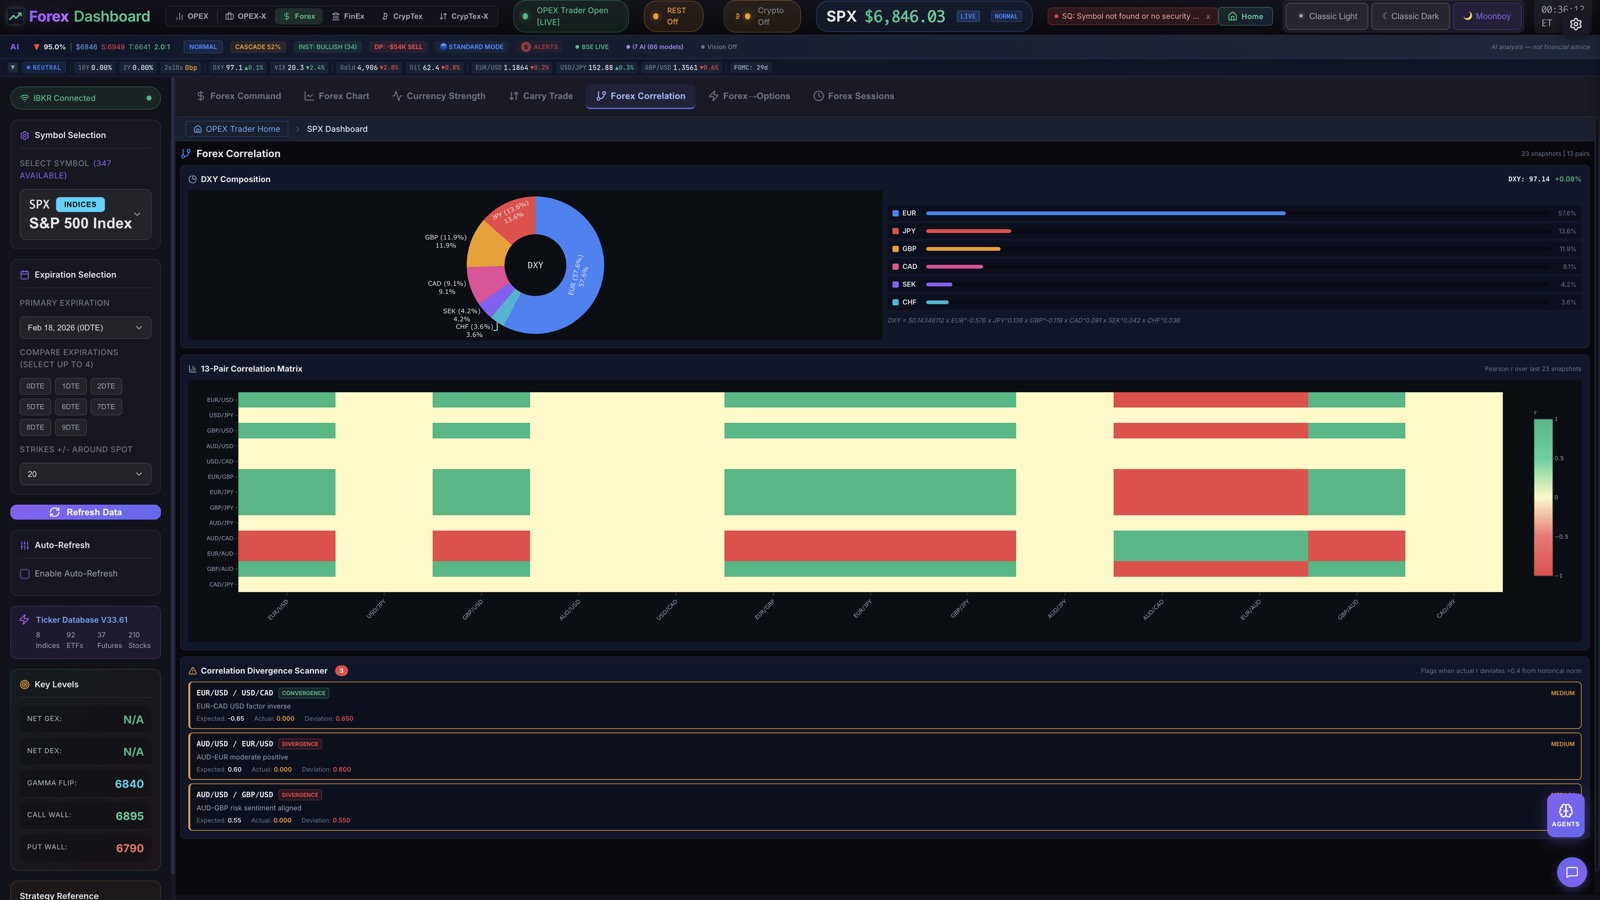
Forex Correlation
13×13 pair correlation heatmap, DXY decomposition analysis, divergence scanner, and cross-asset correlation tracking.
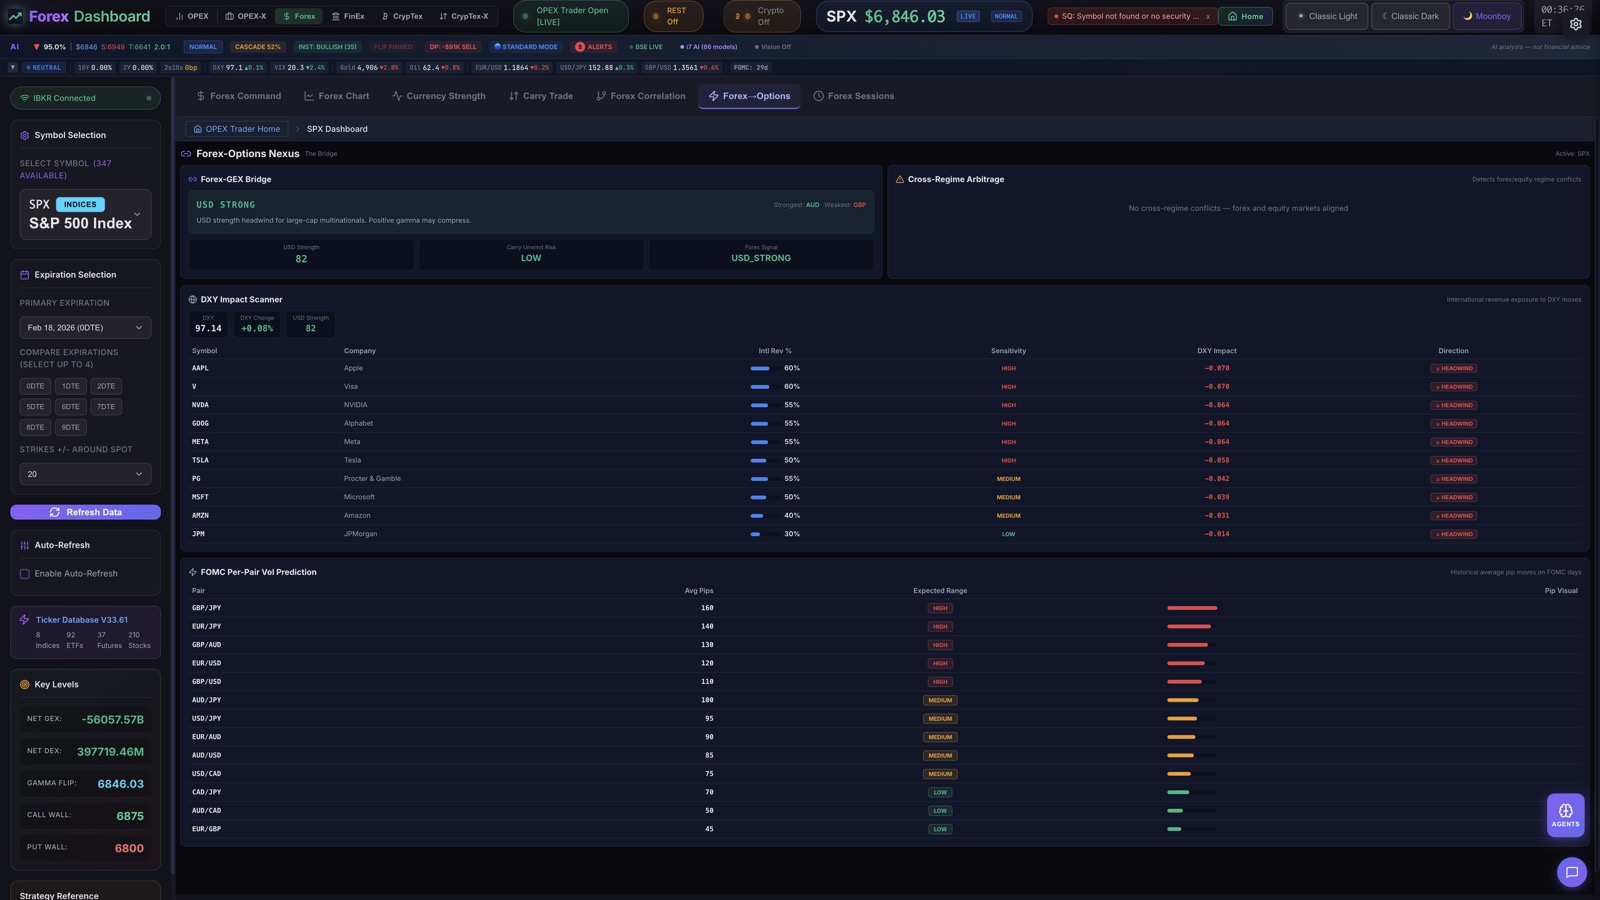
Forex→Options Nexus
DXY impact scanner linking currency moves to equity options. Forex-GEX bridge, FOMC volatility prediction, and cross-regime arbitrage signals.
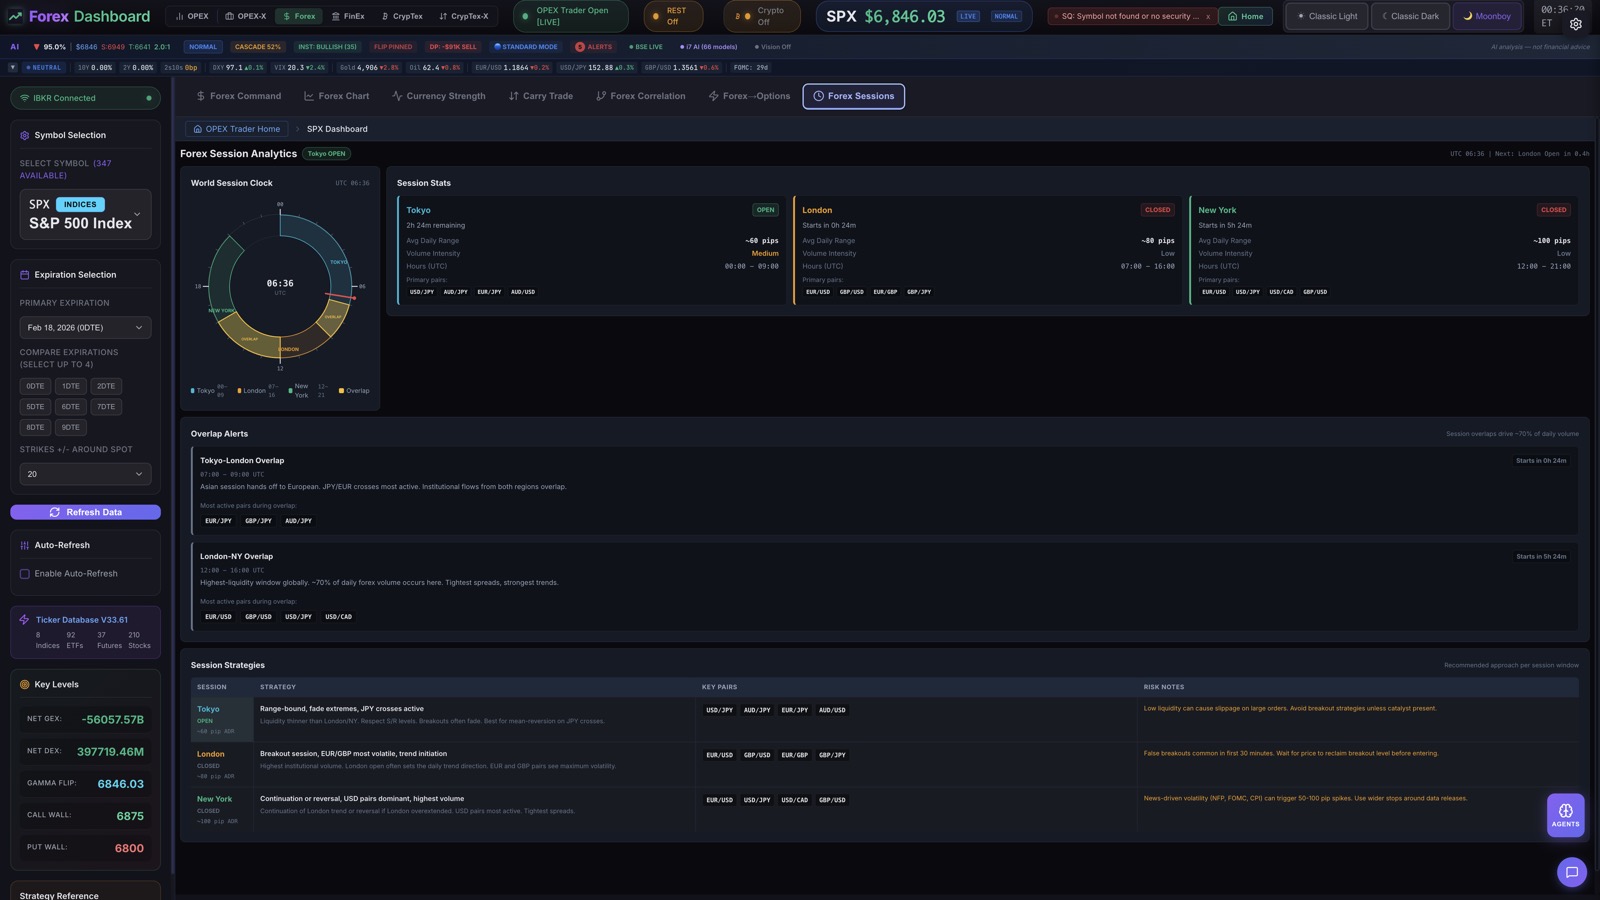
Forex Session Analytics
24-hour world clock with Tokyo, London, and New York session stats. Overlap alerts, session-specific strategies, and historical session performance.
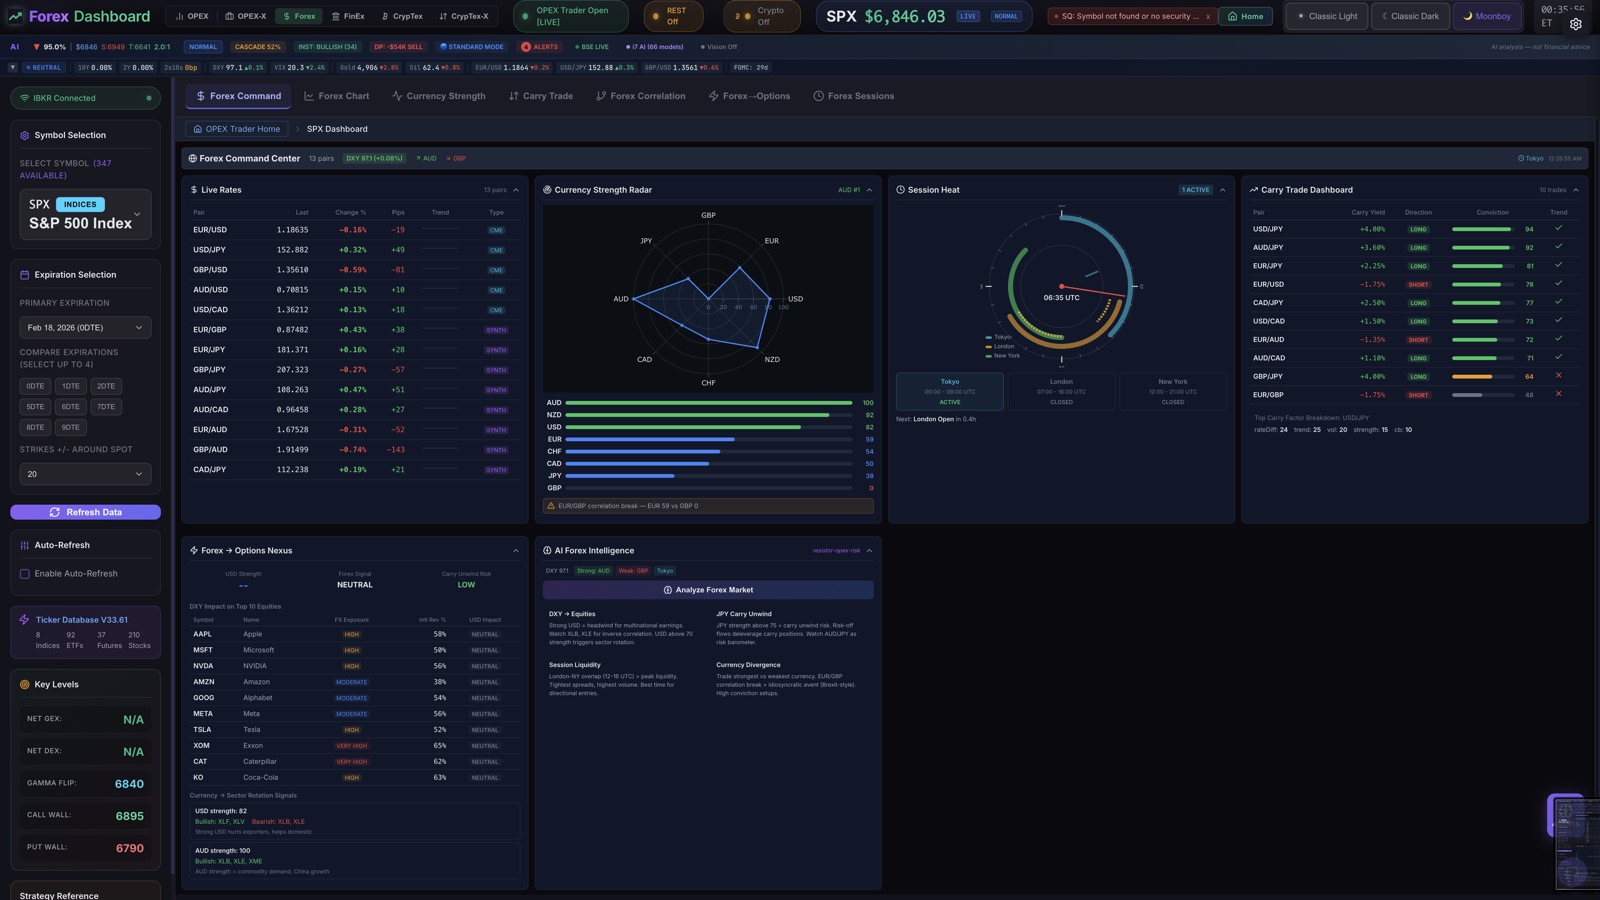
Forex Command Center
Forex Session Analytics
Forex Correlation
Forex→Options Nexus
FinEx Intelligence
7-Tab Financial Sector Analytics
Deep financial sector analysis purpose-built for rate-sensitive trading. Treasury yield curve modeling, bank performance tracking, FOMC scenario simulation, and sector rotation scoring across 51 financial stocks.
Financials Command Center
Rate regime impact dashboard with bank leaderboard, yield curve overlay, sector flow predictions, and Fed policy scenario analysis.
Treasury Lab
Interactive yield curve analysis with spread dashboard, curve trade scanner, forward rate extraction, and historical curve comparison.
Bank Dashboard
3×3 grid tracking JPM, GS, MS, BAC, WFC, C, SCHW, USB, PNC with NIM analysis and relative performance charting.
Sector Rotation
11-sector momentum rankings with 4-quadrant rotation matrix, capital flow predictions, and sector-to-rate sensitivity mapping.
Rate Impact Analyzer
Interactive –100bp to +100bp rate simulator. FOMC scenario matrix with per-stock deep-dive impact analysis and hedge recommendations.
Financial Sector Chart
XLF/KRE/KBE charting with 2s10s yield curve overlay, FOMC meeting markers, rate regime badges, and sector ETF comparison.
Rate Sensitivity Screener
51-stock ranking table sorted by rate sensitivity. Scatter plot visualization, sensitivity percentiles, and rate hedge recommendations.
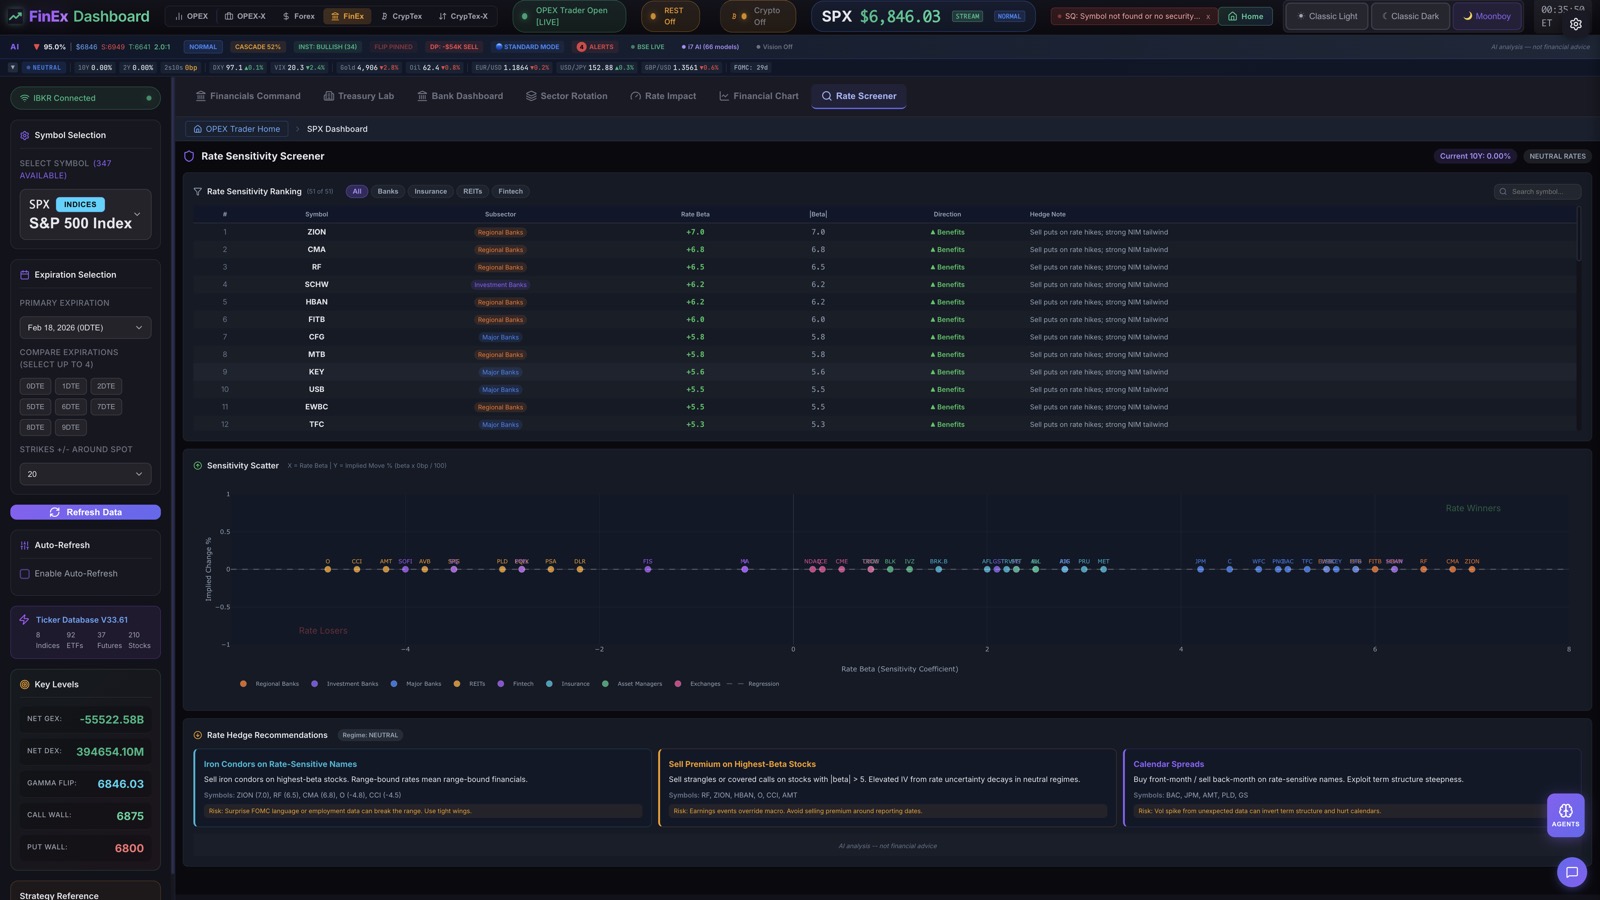
Rate Sensitivity Screener
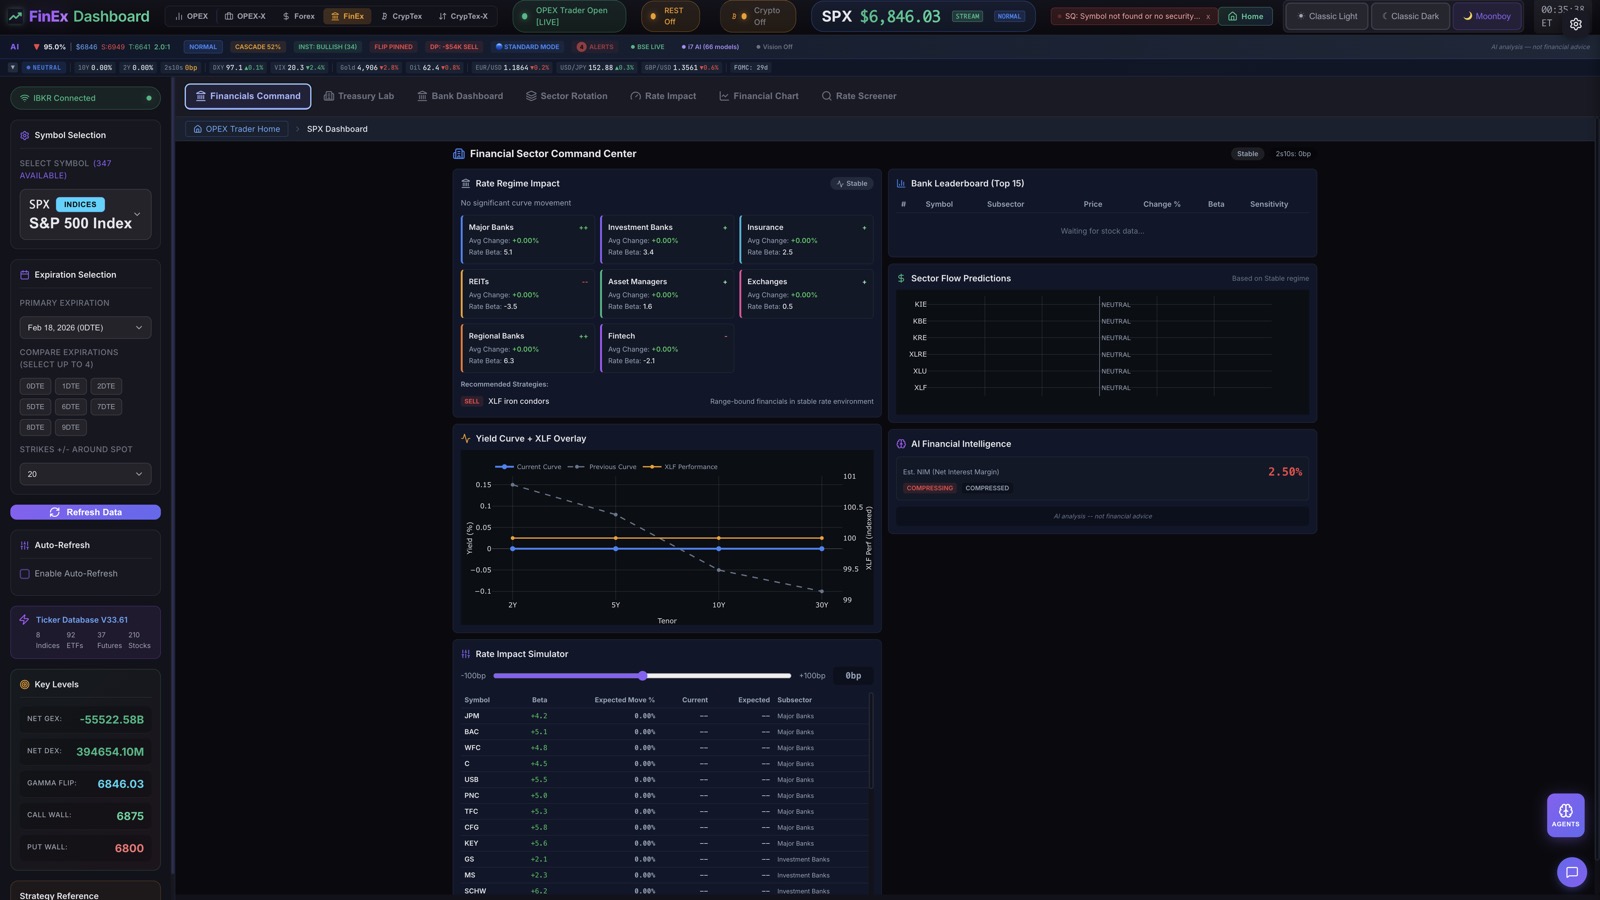
Financials Command Center
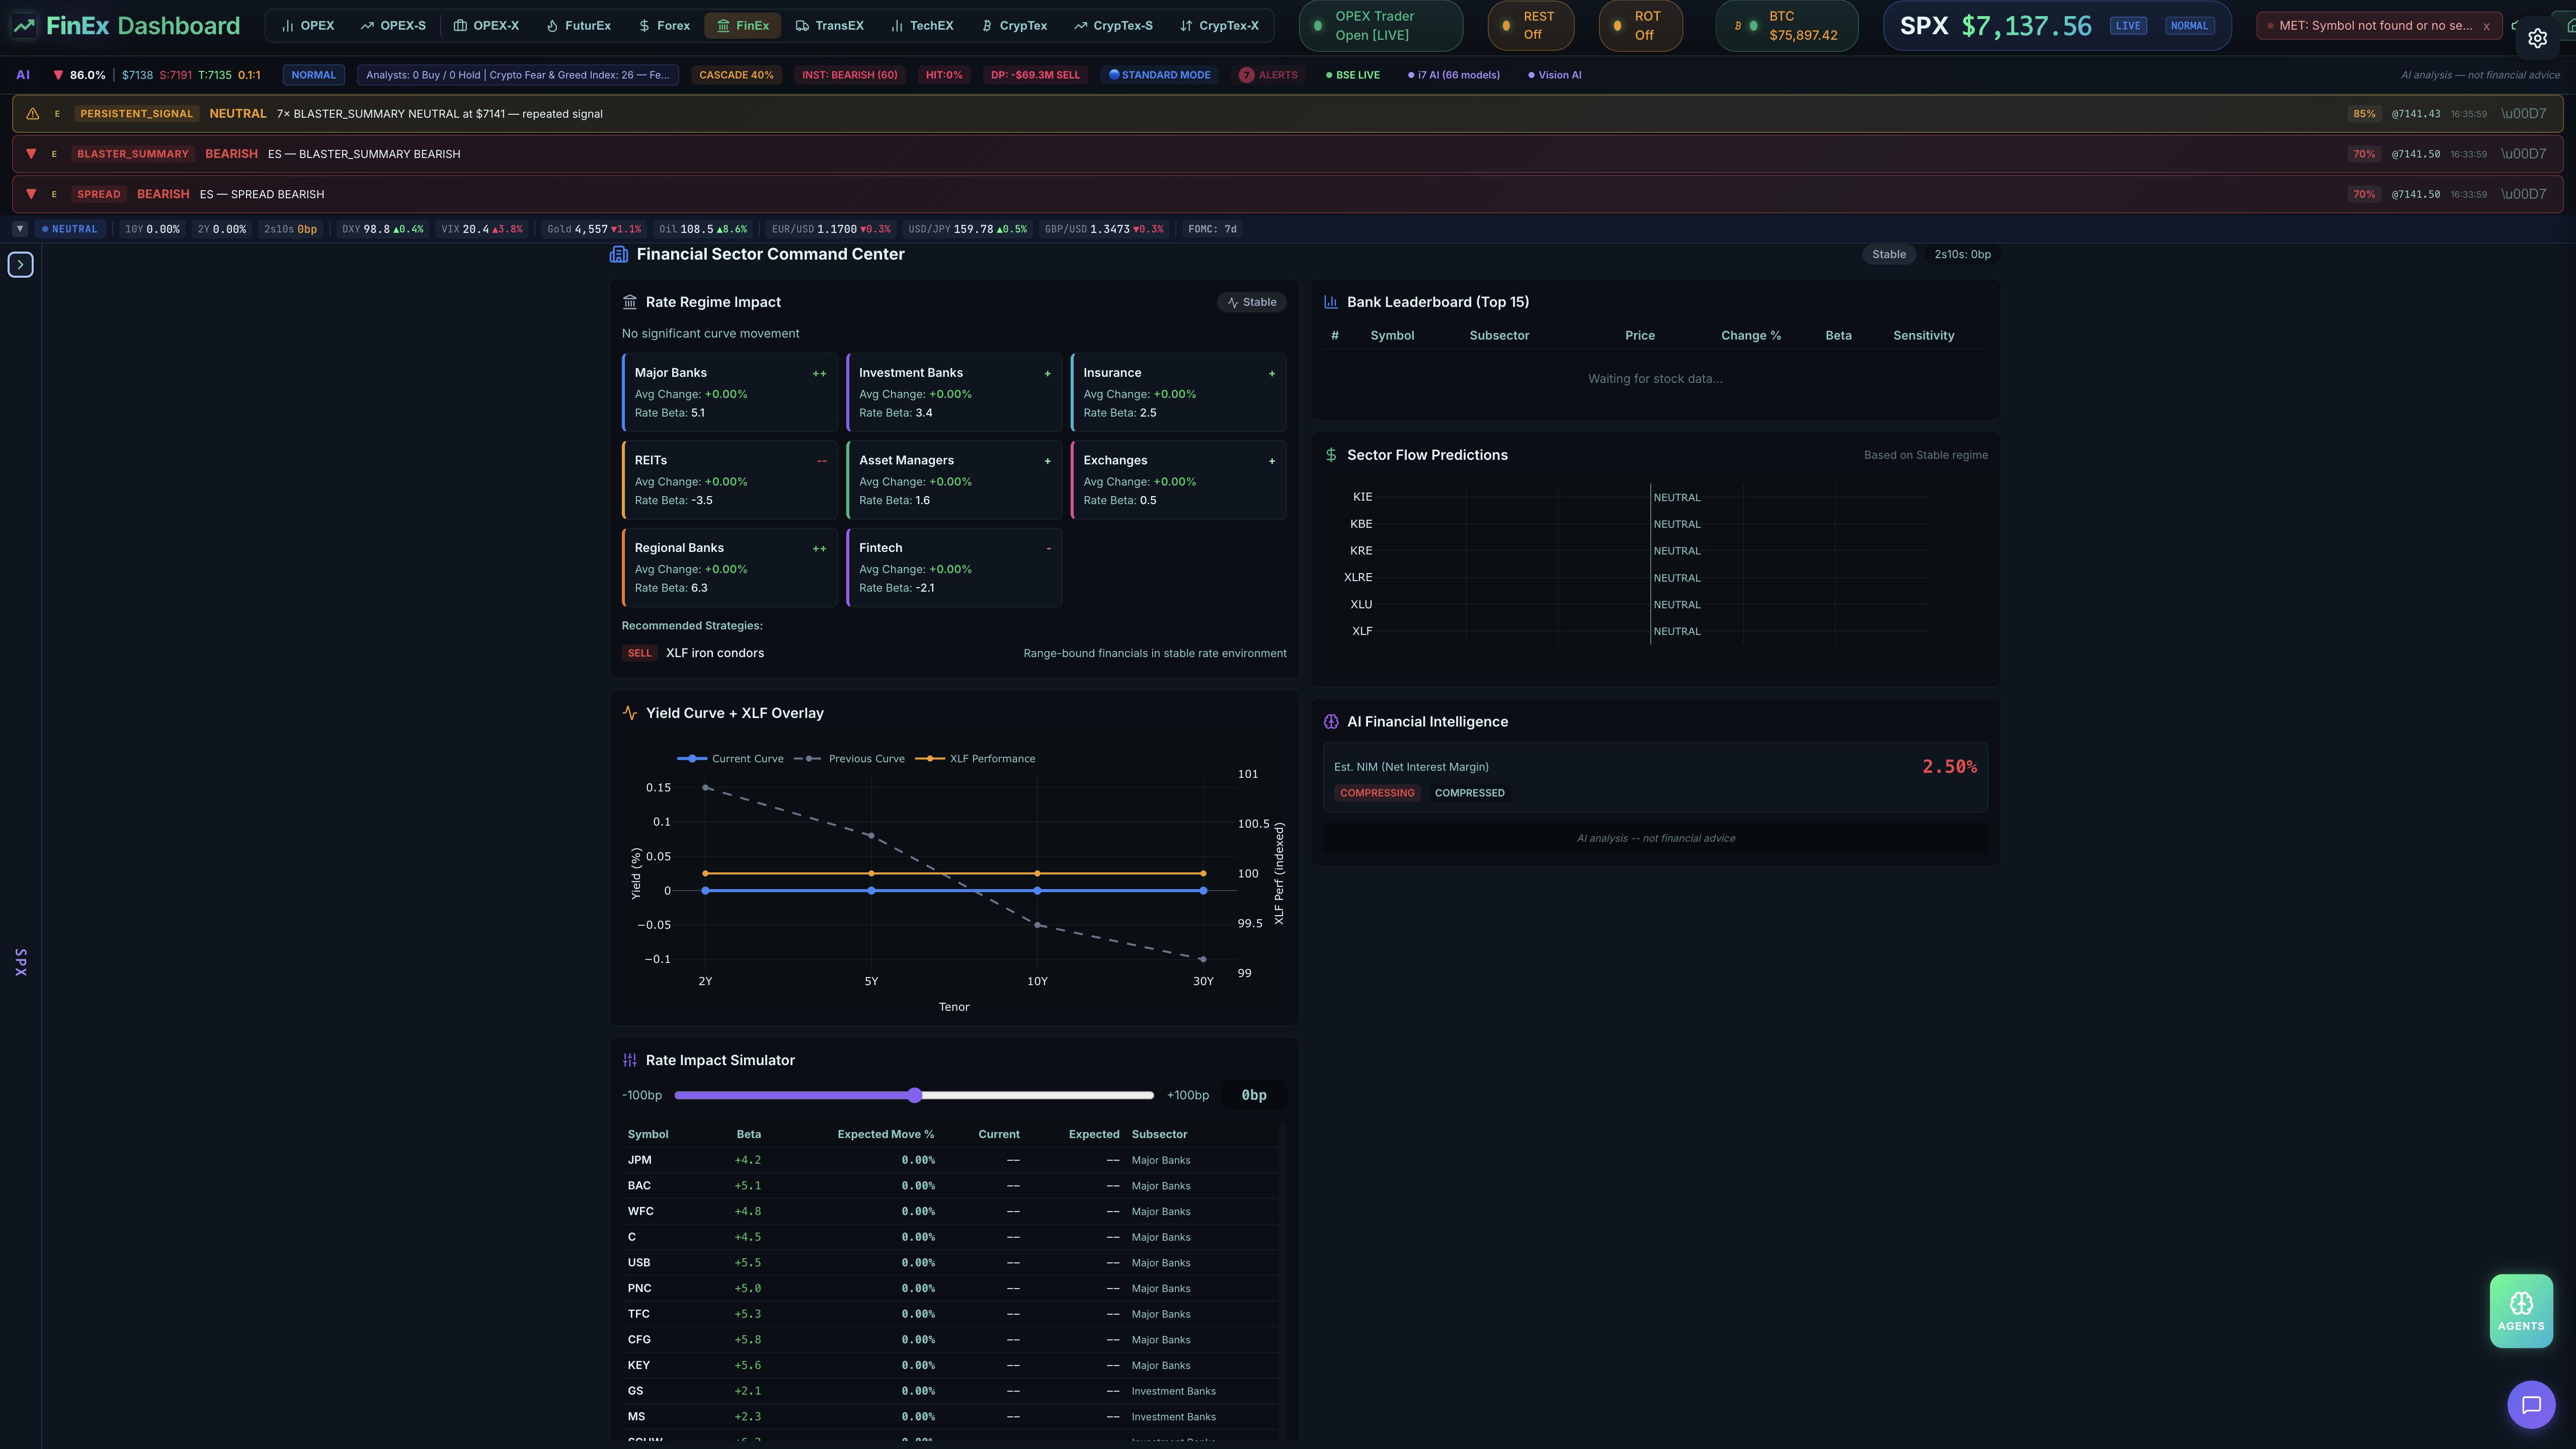
Rate Regime & Yield Curve Analysis
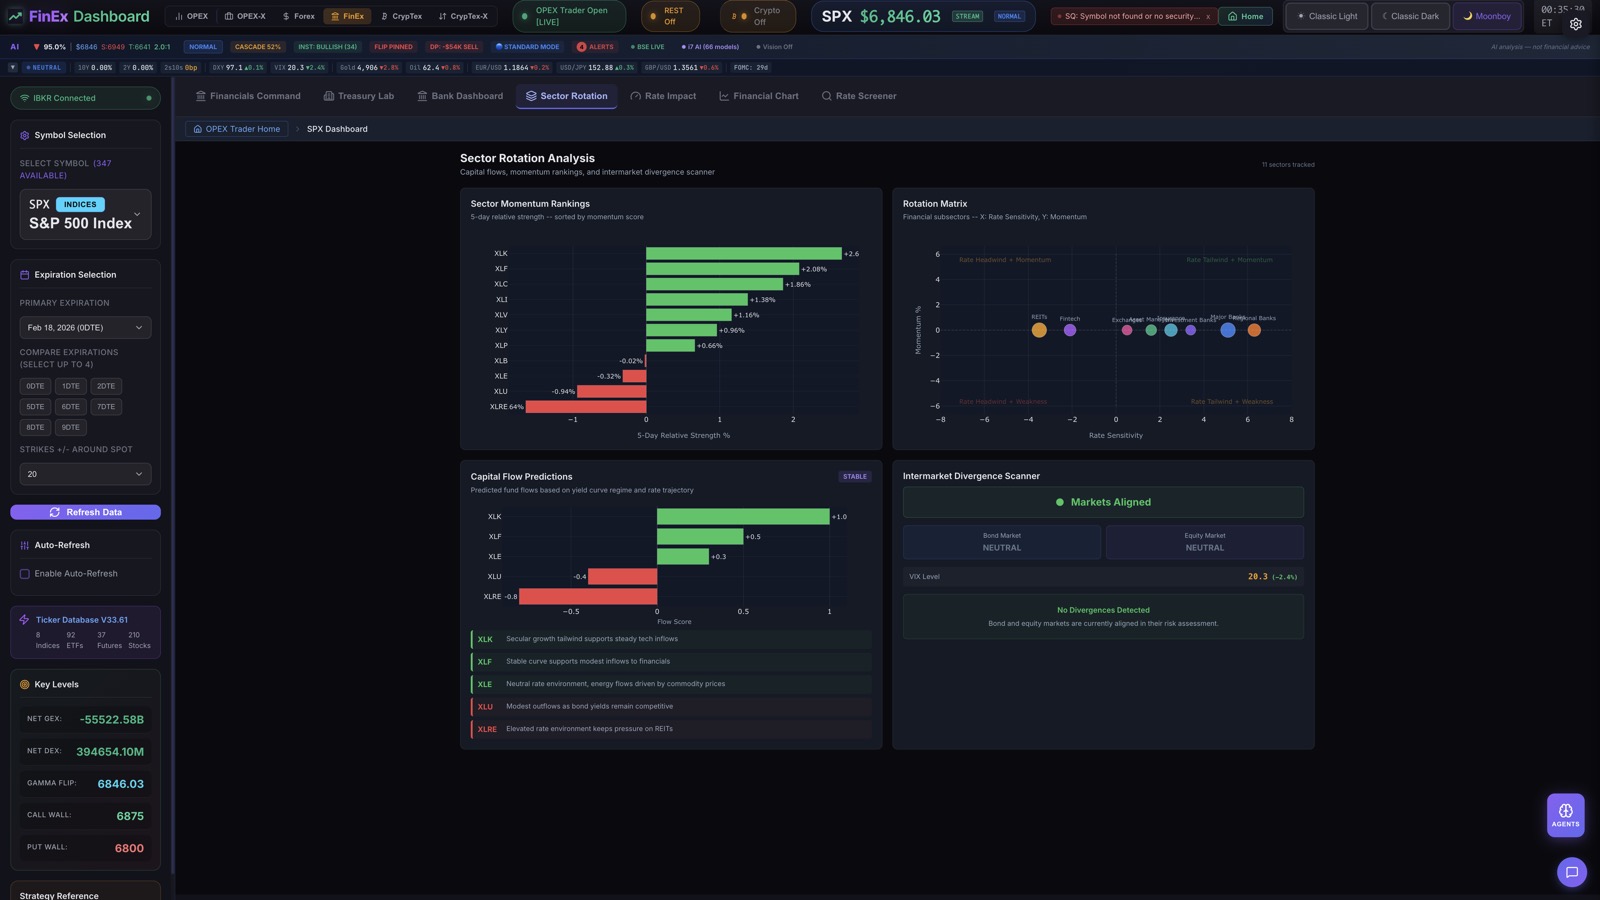
Sector Rotation
TransEX Intelligence
26-Tab Transportation Sector Analytics
Deep transportation sector analysis covering airlines, rail, trucking, shipping, EV, auto, aerospace, rideshare, and infrastructure. Each sub-sector features dedicated dashboards with fuel/commodity correlation tracking and supply chain disruption detection.
Airlines Dashboard
Real-time airline sector tracking with jet fuel correlation, load factor analysis, seasonal patterns, and fare pricing intelligence across major carriers.
Rail & Trucking Command
Class I railroad and LTL/FTL trucking analytics. Intermodal volume tracking, freight rate indices, and tonnage-to-GDP correlation signals.
Shipping & Maritime
Container shipping rates (BDI, SCFI), port congestion monitoring, tanker fleet utilization, and global trade route disruption alerts.
EV & Auto Intelligence
Electric vehicle delivery tracking, charging infrastructure rollout, legacy auto transition metrics, and battery commodity correlation (lithium, cobalt, nickel).
Supply Chain Monitor
End-to-end supply chain visibility. Semiconductor lead times, port-to-warehouse transit metrics, inventory-to-sales ratios, and disruption cascade modeling.
Infrastructure & Rideshare
Aerospace defense contracts, infrastructure bill spending flow, rideshare market share tracking, and autonomous vehicle development milestones.
9 Sub-Sector Categories
OPEX-S — Spot Equities
Institutional Analytics Without Options
42 tabs of professional TA, fundamentals, AI, and pattern detection on 729 tickers. No broker needed. No options knowledge required.
Pro Chart + Nova 3D Spot Edition
GPU-accelerated 2D charting with 28 overlays plus Nova 3D Spot Edition — SMA/Fibonacci/VWAP beams, momentum terrain, pattern markers. Every ticker, no options needed.
140+ Pattern Detection
Full pattern library: 65 chart patterns and 76 candlestick patterns. Pattern scoring with statistical win rates, failure rates, and reliability rankings.
MEI Perfection (93%)
Proprietary three-tier Market Efficiency Index for spot equities. Calls macro tops and bottoms with 93% accuracy. Blue MACRO BOTTOM. Purple MACRO TOP.
AI Command Center + Fundamentals
Yahoo Finance fundamentals on every ticker, 4-source news aggregation, AI sentiment scoring, paper trading, and the full AI Command Center — all without a broker connection.
CrypTex-S — Spot Crypto
Pure Spot Crypto Intelligence
42 tabs covering 77 coins via CoinGecko + Coinbase. Patterns on 1-min candles, order book whale walls, Fear & Greed, Triple Basis Dashboard. No exchange account needed. Every major coin.
77 Coins — CoinGecko + Coinbase
Real-time spot data for 77 coins via CoinGecko and Coinbase. L2 order book depth, trade flow, WebSocket streaming, and market cap rankings.
Patterns on 1-Min Candles
140+ chart and candlestick patterns running on 1-minute crypto candles. Real-time pattern scanning across all 77 coins simultaneously.
Order Book Whale Walls
L2 order book visualization with whale wall detection. See where large liquidity pools cluster and how they shift in real time.
Fear & Greed + Triple Basis
Real-time crypto Fear & Greed Index, Triple Basis Dashboard comparing spot vs perpetual vs quarterly, and cross-exchange sentiment aggregation.
AI System
God Stack — 7-Tier AI Architecture
A hierarchical multi-agent system purpose-built for options analysis. Each tier runs a custom-trained model optimized for its domain, orchestrated by a 32B parameter commander. 134 agents across 87+ models.
134
Total Agents
87+
Custom-Trained Models
150K+
Signals Scored
75.7%
Overall Win Rate
48
Signal Types
100%
Local Execution
OPEX-CommanderStrategic orchestration, multi-agent coordination, final verdict synthesis
OPEX-GEX EngineGEX/DEX formulas, dealer hedging, cascade scoring, vol regime, 0DTE gamma
OPEX-Spread Engine27 spread types, MM pain, OTM signals, institutional detection, earnings methodology
OPEX-FastFast inference, routine analysis, data validation, formatting, summarization
OPEX-VisionChart pattern recognition, screenshot analysis, visual anomaly detection
OPEX-Risk EngineVaR, risk scoring, volatility skew analysis, Kelly criterion, anti-fragility metrics
OPEX-ArchitectArchitecture planning, code generation, implementation strategy, code review
War Room Debate
4-agent adversarial debate system. Bull, Bear, and Neutral agents argue positions before a synthesizer delivers a final verdict with conviction scoring.
Pre-Market Brief
Automated 9:00 AM ET analysis. Three agents run in parallel to scan overnight developments, key levels, and trade setups before market open.
Signal Intelligence
Background Signal Engine monitors 198 tickers across 55+ signal types with 3-tier monitoring: Tier 1 (12 tickers every 2 min), Tier 2 (50 tickers every 5 min), Tier 3 (136 tickers 6x daily). ~35,000 signal events per trading day. 75.7% overall win rate across 150,000+ signals scored.
Autonomous Scheduling
Auto-validate every 10m, signal accuracy checks every 15m, risk sentinel every 20m. Market open and close triggers with event-driven routing.
Market Brief
15 scheduled intelligence intervals across 6 subscription tiers. From pre-market overnight analysis to EOD session recap. Your AI Command Center delivers actionable briefs before you even open the app.
Orchestration Layer
PrimeEX — The Brain Behind the Fleet
Every signal that fires in OPEX feeds into PrimeEX — the orchestration layer that coordinates 134 AI agents in 9 specialized chains. PrimeEX recalls similar patterns from federated memory, triggers the right agent chain, generates narration via local AI, and delivers actionable intelligence to your Command Feed.
Signal → Classification → Risk Assessment → Trade Recommendation
Pattern Detected → Historical Recall → Confidence Scoring
Regime Change → Portfolio Impact → Hedge Suggestion
Kill Chain Cluster → Multi-Agent Debate (War Room) → Consensus
Spread Structure → MM Behavior Analysis → Duration Estimate
Crypto Confluence → Dual-Source Validation → Entry Timing
Earnings Approaching → IV Analysis → Premium Strategy
Insider Activity → Divergence Check → Conviction Stack
Market Brief → Multi-Source Synthesis → Narrated Summary
No other platform orchestrates 134 AI agents across 9 reasoning chains with federated memory recall.
Floor Agents
5 AI Trading Personalities
Chat with Wolf, Condor, Theta, Degen, and Rookie in real-time. 3-second responses powered by GPU-accelerated Ollama models with an extensive trading knowledge base. Each agent runs on a dedicated AI model with a unique trading philosophy, risk tolerance, and communication style. They don't just analyze — they have opinions.
WOLF
Aggressive directional
“Put wall cracks, dealers flooding shorts. Watch 5900 support.”
CONDOR
Spread specialist
“Iron Condor at 5900/5925/5975/6000 — containment range confirmed.”
THETA
Vol surface nerd
“IV rank 72 > HV 17. Sell premium. Hedge pin risk below 5950.”
DEGEN
High-conviction momentum
“Gamma squeeze loading. 0DTE calls, full send.”
ROOKIE
Patient educator
“Here's why that iron condor works in this GEX regime...”
Each model has 40 real Q&A examples from an extensive trading knowledge base baked into a 10,000-character system prompt. They don't just have personality — they have domain expertise.
GPU-Accelerated
2 Minutes → 3 Seconds
134 AI agents. GPU-accelerated at 78 tokens/sec. Faster than ChatGPT. No cloud API. No per-token charges. Unlimited AI at every tier.
| Analysis | Cloud GPT | OPEX (Local GPU) |
|---|---|---|
| Signal analysis | 5-15 sec | <1 sec |
| Kill Chain scoring | 30-60 sec | 3.6 sec |
| Brain Dump synthesis | 20-45 sec | 2.4 sec |
| War Room (4 agents) | 2-4 min | 12 sec |
| Market Brief | 1-3 min | 10-20 sec |
| Full fleet sweep | 30+ min | <5 min |
| Cost per query | $0.02-2.00 | $0.00 |
No tokens to buy. No API limits. No monthly AI surcharge. Your subscription includes unlimited AI at every tier.
Your AI. Your Hardware. Zero Cloud Dependency.
OPEX doesn't send your data to OpenAI, Google, or any cloud provider. All 134 AI agents run on local GPU hardware. Your trading data never leaves your machine.
Knowledge Base
1,254 Training Facts Across 10+ Domains
Every AI agent is trained on real trading methodology, not generic internet data. An extensive curated knowledge base spanning the most critical domains in options and technical analysis.
Options Pricing & Greeks
Volatility models, pricing theory, Greek sensitivities
Volatility Surface Analysis
Skew dynamics, term structure, vol regimes
Chart Pattern Recognition
140+ patterns with statistical win/failure rates
Spread Strategy & Structure
Multi-leg construction, lifecycle tracking, P&L modeling
Dynamic Hedging
Delta management, gamma scalping, portfolio protection
Elliott Wave & Fibonacci
Wave counting, fractal nesting, ratio projections
Gamma Exposure (GEX)
Dealer positioning, cascade risk, hedge flow mechanics
Market Microstructure
Order flow, dark pools, institutional footprints
Risk Management
VaR, scenario analysis, position sizing, regime detection
Crypto Derivatives
24/7 options, perpetual funding, cross-asset correlation
Pattern Detection
140+ Pattern Detectors
Comprehensive chart and candlestick pattern recognition scanning every timeframe from 1-minute to monthly. Powered by a full pattern encyclopedia and classical Japanese candlestick methodology.
65 Chart Patterns
Full Pattern Encyclopedia
76 Candlestick Patterns
Grouped by Family
Multi-Timeframe Scanning
Proprietary Intelligence
Proprietary Intelligence Engines
Six first-of-their-kind analytical engines built from scratch. These are not available anywhere else — proprietary signal generation, fractal structure detection, and automated trade construction.
MEI Perfection
Proprietary three-tier Market Efficiency Index. Green/Orange swing signals plus Blue MACRO BOTTOM and Purple MACRO TOP alerts. 5-rule conviction scoring. Backtested 2020-2026 with 95%+ macro accuracy.
Kill Chain Trade Generator
Auto-detects signal clusters and generates full trade cards. Three chains: DEX (intraday scalp), Flow (multi-day swing), Signal (cluster burst). Strike, entry, target, stop, R:R, position size — all automated.
Spread Hierarchy Classifier
First-of-its-kind fractal spread structure detection. Micro diagonals (4-10 min) to intra-hour condors (18-25 min) to hourly megas to session range. Cycle phase prediction.
Algo Rhythm Tracker
Identifies the algorithm behind H&S, wedge, and triangle patterns. H&S liquidity zone mapping. Cross-timeframe algo chain linking 5m patterns to daily structures. Apex countdown with breakout prediction.
Fractal Template Engine
Proves lower-TF Elliott Waves are miniature clones of higher-TF. Fibonacci ratio comparison across timeframes. Projects targets from completed lower-TF templates.
Liquidity Channel Engine
Automatic channel detection with boundary touch signals. H&S/iH&S initiator mapping. Apex projection with convergence detection. Break detection with volume confirmation.
Nova Prime Tracker
Institutional entity detection tracking market-moving entities through 4 phases: DIRECTION_FLIP, PHASE_TRANSITION, EXHAUSTION, CYCLE_RESET. First-of-its-kind entity-level market driver detection.
Gamma Peak Pin
Identifies peak dealer gamma strike as pin target in the final 60 minutes. Powers the 87.5% Power Hour win rate with a dedicated gamma pin detector.
Spread Analysis
27 Spread Types Detected
Full spread lifecycle tracking — from entry setup through active management to close. Every spread type is automatically identified, tracked, and scored with P&L projections.
Lifecycle Tracking
Automatic spread identification with stage-by-stage lifecycle tracking from opening through expiration.
2D + 3D P&L
Interactive P&L diagrams with breakevens, plus 3D Price x DTE x P&L surface visualization in Plotly.
MM Position Analysis
Market maker inventory detection with positioning inference and hedging flow attribution.
Dominant Detection
Automatic dominant spread identification across all active expirations with confidence scoring.
Spread Structure Tracking — Continuous Entity Monitoring
OPEX tracks market maker spread structures as continuous entities across hours and days — not disconnected snapshots. Each structure is monitored through its full lifecycle with three signal types: STRUCTURE_ACTIVE, DIRECTION_FLIP, WING_BREAK. This is the only platform that treats spreads as living entities rather than point-in-time observations.
3 Chart Engines — 10,000+ Lines
Revolutionary Charting Suite
Three chart engines powering 67 indicator functions, 75+ 3D toggles, 28 overlay indicators, 15+ drawing tools, 4 chart types, and 4 camera modes. No retail platform has anything like OpexView Nova.
OpexView Pro Chart 2D
GPU-accelerated via TradingView Lightweight Charts v5. 28 overlay toggles (MA/EMA/Ribbon, VWAP Bands, Bollinger, Keltner, Ichimoku, Supertrend, Parabolic SAR, CVD, Volume Profile, GEX Zones, AI Overlay). 5 oscillator sub-panes (RSI, MACD, Stochastic, ADX, AI Momentum). 15+ drawing tools with auto-Fib. 4 chart types. Multi-chart layouts.
OpexView Nova 3D — Dual Edition
The world's first true 3D interactive trading chart. 75+ indicators rendered as holographic 3D objects. 4 camera modes (orbit, front, side, fly-through). Bloom and vignette post-processing. Ships in two editions:
GEX Edition
Real Call Wall, Put Wall, Gamma Flip beams + full options context. Dealer hedging as force planes, OI as volumetric columns.
Spot Edition
SMA/Fibonacci/VWAP beams, momentum terrain, pattern markers — every ticker, no options needed. Available in OPEX-S and CrypTex-S.
67 Indicator Functions
Shared calculation engine across all chart styles. Trend (SMA, EMA, WMA, HMA, DEMA, TEMA, Alligator, GMMA). Volatility (Bollinger, Keltner, Donchian, ATR). Momentum (RSI, MACD, Stochastic, ADX, CCI, Williams %R, ROC, TSI, Fisher). Volume (OBV, MFI, CVD, CMF, Klinger, A/D). Plus Plotly for 3D surfaces, heatmaps, and risk visualizations.
OpexView Nova 3D — Live Demo
75+ indicators as holographic 3D objects. 4 camera modes. The world's first true 3D interactive trading chart.
Included Indicators
Risk Management
Multi-Layer Risk Intelligence
Portfolio-level risk analysis with Greeks aggregation, scenario simulation, correlation monitoring, and AI-driven regime classification. Know your exposure before the market moves.
Portfolio Greeks
Aggregate Delta, Gamma, Theta, Vega across all positions. Drill down by symbol, expiration, or strategy. Real-time P&L attribution.
Risk Heatmap
Interactive Price x DTE risk matrix. Run scenario analysis across 5 metrics: P&L, Delta, Gamma, Theta, Vega. Color-coded risk scoring.
Correlation Matrix
15-symbol cross-correlation heatmap with Pearson coefficient calculation across 4 timeframes. Identify diversification gaps.
Liquidation Heatmap
Leverage-based liquidation cluster mapping (2x-50x). Identifies price levels where cascading liquidations are likely to trigger.
VaR Calculations
Value-at-Risk with historical simulation, parametric, and Monte Carlo methods. Kelly criterion position sizing and anti-fragility scoring.
Regime Autopilot
Automatic market regime classification (Trending, Mean-Reverting, Volatile, Calm). Dynamically adjusts risk parameters and strategy selection.
Customization
4 Custom Themes
Every tab, chart, panel, and sidebar adapts to your chosen theme. Trade in the vibe that fits you.
Classic Dark
The default. Deep blacks, blue accents. Built for focus.
Classic Light
Clean white canvas with high contrast. Easy on the eyes in daylight.
Moonboy
Electric blues and purples. The bull energy theme.
Moongirl
Soft pinks and warm tones. Elegant and distinct.
Full Inventory
All 390+ Tabs — Searchable
Browse every analytics module organized by category. OPEX Trader ships with 80+ equity/futures options tabs, 42 OPEX-S spot equity tabs, 40 FuturEx tabs, 7 Forex tabs, 8 FinEx tabs, 26 TransEX tabs, 97 CrypTex crypto derivatives tabs, and 42 CrypTex-S spot crypto tabs across 11 trading modes.
Showing 135 of 135 tabs
GEX Dashboard
Real-time gamma exposure and dealer hedging
Options Chain
Full chain with Greeks and flow detection
Max Pain
Expiration pain-point and settlement analysis
Watchlist
Multi-symbol monitoring with conviction ranking
Homepage AI Center
15-symbol scan with sector rotation
Dashboard
Overview with key metrics and market pulse
Settings Panel
Broker config, data connection, defaults
Connection Wizard
4-step guided broker setup
Agent Panel
134 agent command center with tiered AI architecture
War Room
4-agent adversarial debate with synthesis
Pre-Market Brief
Automated 9AM ET analysis briefing
AI Trade Journal
Trade logging, equity curve, CSV export
AI Trading Assistant
Direct AI assistant with trading knowledge
AI Status Bar
Live agent activity and inference status
Keyboard Commander
Spotlight command palette (Ctrl+P)
Vol Skew Lab
Advanced skew surface analysis
Vol Curve
Term structure with forward vol
Skew Reversal Heatmap
Cross-asset skew reversal command center
Volatility Surface 3D
Interactive 3D IV surface
IV Rank / Percentile
Historical IV context and extremes
Realized vs Implied
RV/IV spread analysis
Spread Scanner
27 spread types with lifecycle tracking
Spread Visualization 2D
P&L diagrams with breakevens
Spread Visualization 3D
Price x DTE x P&L surface
Long-Term Spreads
LEAPS and long-duration strategies
Earnings Spreads
Event-driven spread methodology
MM Position Scanner
Market maker positioning analysis
Dark Pool
Off-exchange block trade monitoring
Unusual Activity
Anomalous volume and OI detection
Algo Scanner
Algorithmic order flow identification
OTM Scanner
Out-of-the-money signal detection
Institutional Flow
Large-lot and sweep trade tracking
Block Trade Monitor
Real-time block trade alerts
Signal Timeline
Chronological 8-type signal feed
Signal Historian
Historical signal accuracy tracking
Alert Intelligence
Smart alert prioritization and routing
Sniper Mode
Precision entry/exit with R:R and cascade risk
OTM Signal Tracker
OTM cluster monitoring and alerts
OpexView Chart
Core 2D charting engine — clean, fast candlestick rendering with essential indicators and overlays
OpexView Pro Chart
GPU-accelerated 2D charting — 28 overlays, 5 oscillator sub-panes, 15+ drawing tools, 4 chart types
OpexView Nova (3D)
First-of-its-kind 3D interactive chart — 75+ indicators as holographic 3D objects, 4 camera modes. Dual editions: GEX Edition (options context) and Spot Edition (no options needed)
Multi-Timeframe
1min to Monthly synchronized views
GEX Chart
Gamma exposure overlay on price
0DTE Chart
Zero-day expiration focused analysis
Volume Profile
Price-at-volume distribution
Tick Chart
Tick-level price action
Pattern Scanner
65 chart patterns with win rates
Candle Scanner
76 candlestick pattern families
Harmonic Patterns
Gartley, Bat, Butterfly, Crab detection
Divergence Scanner
RSI, MACD, OBV divergence alerts
Risk Manager
Portfolio-level risk dashboard
Portfolio Risk Heatmap
Price x DTE risk matrix with scenarios
Correlation Matrix
15-symbol cross-correlation heatmap
Liquidation Heatmap
Leverage-based liquidation clusters
Monitor
Real-time position and P&L monitoring
Regime Autopilot
Automatic market regime classification
Sector Rotation
Cross-sector strength analysis
Earnings Calendar
Event-driven opportunity scanner
Macro Dashboard
Macro indicators and regime context
Correlation Tracker
Dynamic correlation monitoring
Trade Planner
Entry/exit strategy with risk parameters
Position Builder
Multi-leg position construction
Order Flow
Real-time order book analysis
Greeks Explorer
Interactive Greeks visualization
Backtest
Historical strategy validation
Forex Command Center
6-panel nerve center: live rates, currency strength radar, session heat, carry trades, Forex→Options Nexus
Forex Pro Chart
13 pairs, 6 timeframes, session boxes, pivot points, ADR/AWR bands, GEX overlays
Currency Strength Index
8x8 strength heatmap, divergence alerts, sector rotation signals
Carry Trade Monitor
5-factor conviction engine, risk-adjusted rankings, carry vs momentum scatter
Forex Correlation
13x13 correlation heatmap, DXY decomposition, divergence scanner
Forex→Options Nexus
DXY impact scanner, Forex-GEX bridge, FOMC vol prediction, cross-regime arbitrage
Forex Session Analytics
24-hour world clock, session stats, overlap alerts, session strategies
Financials Command Center
Rate regime impact, bank leaderboard, yield curve overlay, sector flow predictions
Treasury Lab
Interactive yield curve analysis, spread dashboard, curve trade scanner, forward rates
Bank Dashboard
3x3 bank grid (JPM, GS, MS...), NIM analysis, relative performance chart
Sector Rotation
11-sector momentum rankings, 4-quadrant rotation matrix, capital flow predictions
Rate Impact Analyzer
Interactive -100bp to +100bp simulator, FOMC scenario matrix, per-stock deep dive
Financial Sector Chart
XLF/KRE/KBE charting with 2s10s yield overlay, FOMC markers, rate regime badges
Rate Sensitivity Screener
51-stock ranking table, sensitivity scatter plot, rate hedge recommendations
Theta Farm
Pin target analysis with call/put crush zones, theta burn rate per minute, and 3 auto-generated trade setups
Cross-Asset Correlation
Real-time correlation matrix across equities, futures, crypto, and forex with pair trading signals
Unified GEX
SPX/SPY/ES combined gamma exposure view with unified dealer positioning
GEX Reactor
Multi-timeframe GEX consensus engine with cross-expiration gamma flow analysis
Risk Scorecard
Portfolio-level risk scoring with factor decomposition and regime-adjusted alerts
Session Recorder
Record and replay trading sessions with signal overlay and decision audit trail
Options Pricing Simulator
What-if pricing engine with Greeks sensitivity analysis and scenario modeling
TransEX Command Center
26-tab transportation sector nerve center with fuel correlation and supply chain disruption detection
Airlines Dashboard
Major carrier tracking with jet fuel correlation, load factors, and seasonal fare patterns
Airlines Pro Chart
Airline sector charting with fuel overlay, capacity utilization, and revenue per mile metrics
Rail Command
Class I railroad analytics with intermodal volume, carload traffic, and precision scheduling metrics
Rail Pro Chart
Railroad sector charting with tonnage overlay, operating ratio tracking, and rate per carload
Trucking Dashboard
LTL/FTL trucking analytics with freight rate indices, tonnage tracking, and driver shortage indicators
Trucking Pro Chart
Trucking sector charting with diesel correlation, load-to-truck ratios, and spot rate trends
Shipping Monitor
Container and bulk shipping rates (BDI, SCFI), port congestion, and tanker fleet utilization
Shipping Pro Chart
Maritime sector charting with trade route visualization, vessel tracking, and freight derivatives
EV Intelligence
Electric vehicle delivery tracking, charging infrastructure rollout, and battery commodity correlation
EV Pro Chart
EV sector charting with lithium/cobalt/nickel overlay, production milestones, and market share trends
Auto Sector
Legacy auto manufacturer analysis with transition metrics, inventory days, and incentive tracking
Auto Pro Chart
Auto sector charting with SAAR overlay, dealer inventory, and consumer sentiment correlation
Aerospace Dashboard
Defense contracts, commercial aviation backlog, satellite launch cadence, and space economy metrics
Aerospace Pro Chart
Aerospace sector charting with order backlog overlay, delivery milestones, and contract award tracking
Rideshare Analytics
Rideshare market share tracking, driver economics, autonomous vehicle progress, and urban mobility trends
Infrastructure Monitor
Infrastructure bill spending flow, project pipeline tracking, and construction material cost correlation
TransEX Correlation
Cross-sub-sector correlation heatmap with fuel/commodity sensitivity scoring and regime detection
TransEX Heatmap
Real-time transportation sector heatmap with sub-sector grouping and supply chain disruption alerts
Fuel Correlation Lab
Jet fuel, diesel, and natural gas price correlation with sector-specific impact analysis
Supply Chain Disruption
Global supply chain disruption detection with port delays, route diversions, and cascade impact scoring
TransEX Signal Timeline
Chronological signal feed for transportation sector events, earnings, and regulatory changes
TransEX Sector Rotation
Transportation sub-sector rotation analysis with momentum scoring and capital flow prediction
TransEX Risk Monitor
Transportation-specific risk dashboard with fuel exposure, regulatory risk, and weather event impact
Crypto GEX Dashboard
BTC/ETH gamma exposure via direct exchange feed
Crypto Vol Curve
Crypto term structure analysis
Crypto Skew Lab
Crypto skew surface and forward vol
Crypto OTM Scanner
Crypto OTM signal detection
Crypto Options Chain
BTC/ETH full chain with Greeks
Crypto Max Pain
Crypto expiration pain analysis
Crypto Monitor
24/7 crypto position monitoring
Crypto Pattern Scanner
Chart patterns on crypto pairs
Crypto Candle Scanner
Candlestick patterns on crypto
Crypto Spread Scanner
Crypto spread strategies
Crypto Multi-TF
Multi-timeframe crypto analysis
Crypto Pro Chart
Full crypto charting suite
Crypto Unusual Activity
Anomalous crypto flow detection
Crypto Dark Pool
Off-exchange crypto monitoring
Crypto Liquidations
Leverage liquidation mapping
Crypto Theta Farm
Crypto pin target analysis with crush zones and theta burn rate
Crypto Risk Heatmap
Crypto-specific risk concentration visualization
Crypto Risk Scorecard
Crypto portfolio risk scoring with volatility regime adjustment
Crypto Correlation
Cross-crypto correlation matrix with regime-aware shifts
Crypto Funding Rates
Perpetual funding rate tracking with arbitrage signal generation
Crypto Institutional Flow
Large-lot crypto options flow tracking and whale detection
Crypto Kill Chain
Auto-generated crypto trade cards from signal clusters
Crypto Signal Timeline
Chronological crypto signal feed with accuracy tracking
Crypto Session Analytics
24/7 session breakdown with Asian, European, and US session patterns
Crypto Sniper Mode
High-conviction precision entry for crypto options
97 Crypto Tabs — CrypTex Suite
Institutional-Grade Crypto Analytics
Real-time crypto market intelligence powered by CoinGecko + CoinMarketCap + direct exchange options data. Fear & Greed Index, trending coins, market cap rankings, crypto news — all integrated into the CrypTex suite.
CoinGecko + CoinMarketCap
Live market cap rankings, trending coins, Fear & Greed Index, and crypto news aggregation from the two largest crypto data providers — integrated directly into CrypTex.
Crypto Options Chain
BTC, ETH, and SOL options chains with full Greeks, IV surface, term structure, and gamma exposure — pulled directly from 24/7 exchange data.
100% OPEX Feature Parity
Every feature in the equity suite — GEX Dashboard, Kill Chain, Pattern Scanner, Risk Heatmap, AI Agents — runs identically on crypto. 97 tabs across 11 sidebar categories.
Institutional-Grade Data
10 Real-Time Data Sources. One Unified View.
OPEX aggregates institutional-grade data from 10 sources into every signal, every tab, every decision.
Live Broker Feed
Live options chains, Greeks, streaming quotes, order execution
Crypto Exchange
BTC/ETH/SOL options 24/7 — IV, Greeks, order book
Yahoo Finance
Fundamentals, insider trades, earnings, analyst ratings, short interest
Finnhub
Real-time market news headlines across all sectors
Alpha Vantage
AI sentiment scoring per headline — bullish/bearish/neutral
CoinGecko
15,000+ crypto prices, Fear & Greed Index, trending coins
CoinMarketCap
Crypto news, rankings, market cap, gainers & losers
Coinbase
500+ crypto spot pairs, L2 order book depth, trade flow, WebSocket streaming
Fear & Greed Index
Real-time crypto market sentiment indicator
All data feeds are aggregated locally on your machine. Zero cloud processing. Your data never leaves your device.
Company Intelligence — Powered by Yahoo Finance
Every ticker in OPEX includes full company fundamentals:
P/E ratio, market cap, 52-week range
Insider buying & selling (CEO, CFO, board)
Top 10 institutional holders
Earnings calendar with beat/miss history
Analyst ratings (Buy/Hold/Sell + target price)
Short interest & float data
Dividend yield and ex-dates
20 years of historical price data
Experience all 390+ tabs
Download OPEX Trader and start analyzing options with institutional-grade tools. Local execution, no data leaves your machine, no subscription lock-in.